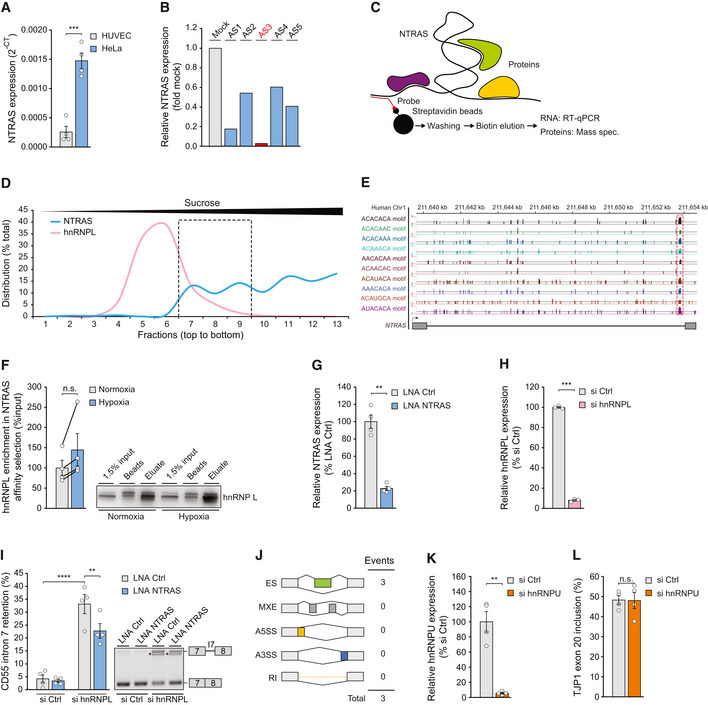
Figure EV2. NTRAS operates as splicing‐regulatory lncRNA.

- Relative expression of NTRAS in HUVECs and HeLa cells, determined by RT–qPCR (n = 4 independent biological replicates).
- RT–qPCR‐based identification of accessible regions within NTRAS using RNase H‐mediated cleavage of RNA–DNA heteroduplexes (DNA antisense oligonucleotides AS1 to AS5) in HUVEC cell lysate (n = 1). The oligonucleotide used for probe design is highlighted in red.
- Scheme illustrating the affinity selection of endogenous NTRAS–protein complexes for RNA and protein analysis.
- Sucrose density gradient ultracentrifugation showing the distribution of NTRAS and hnRNPL (protein). The dashed box indicates the fractions with the greatest overlap of both factors (n = 1).
- Illustration of the human NTRAS locus. Displayed is NTRAS (GRCh38.p13; RP11‐354k1.1) and RBPmap‐predicted hnRNPL binding motifs, described elsewhere (Smith et al, 2013).
- Western blot‐based validation of NTRAS–hnRNPL interaction following antisense affinity selection of NTRAS in nuclear extracts from normoxic and hypoxic HUVECs (n = 4 independent biological replicates).
- Expression of NTRAS in control and NTRAS‐silenced HUVECs used for RNA sequencing (n = 4 independent biological replicates).
- hnRNPL mRNA levels in control and hnRNPL‐silenced HUVECs used for RNA sequencing (n = 3 independent biological replicates).
- RT–PCR‐based analysis of CD55 intron 7 retention following hnRNPL/NTRAS double knockdown in HUVECs (n = 4 independent biological replicates). Representative agarose gel on the right.
- rMATs‐based analysis of alternative splicing events upon silencing of lncRNA lncflow2 in HUVECs (n = 4 independent biological replicates) ES: Exon skipping, MXE: Mutually exclusive exons, A5SS: Alternative 5’ splice site, A3SS: Alternative 3’ splice site, RI: Retained intron.
- Validation of hnRNPU silencing in HUVECs by RT–qPCR (n = 4 independent biological replicates).
- RT–PCR‐based analysis of TJP1 exon 20 inclusion in hnRNPU‐silenced HUVECs (n = 4 independent biological replicates).
Data information: In (A, F–I, K, L), data are represented as mean ± SEM. n.s.: non‐significant, **P < 0.01, ***P < 0.001. (A, F–H, K, and L) two‐tailed unpaired t‐test, and (I) one‐way ANOVA.
Source data are available online for this figure.
