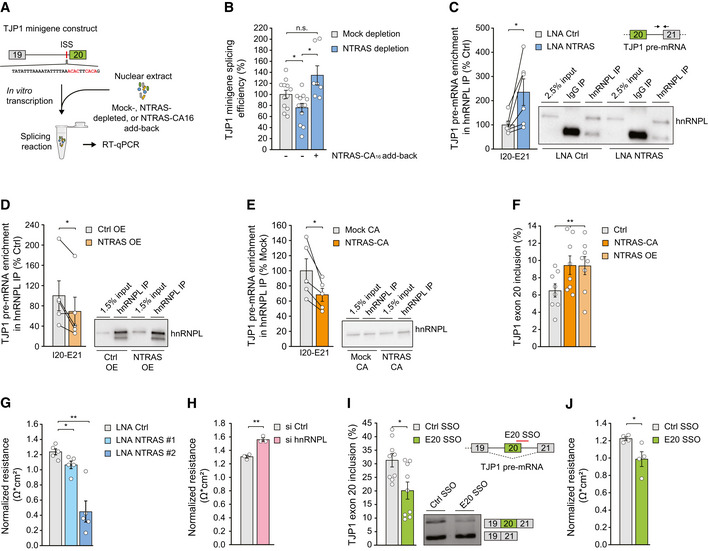
Figure 3. NTRAS controls TJP1 splicing and endothelial barrier function.

- Scheme depicting the in vitro splicing of a TJP1 exon 19–exon 20 splice substrate featuring an intronic splicing silencer (ISS). hnRNPL binding sites are highlighted in red.
- In vitro splicing efficiency of the TJP1 splice substrate, comparing mock, NTRAS‐depleted, and NTRAS‐CA16 motif add‐back conditions (n = 7–12 independent biological replicates).
- Co‐precipitation of TJP1 pre‐mRNA in anti‐hnRNPL RIPs, using nuclear lysates from control and NTRAS‐silenced HUVECs (n = 6 independent biological replicates).
- Co‐precipitation of TJP1 pre‐mRNA in anti‐hnRNPL RIPs, using nuclear lysates from control and NTRAS‐overexpressing cells (n = 5 independent biological replicates). Representative western blot on the right.
- Co‐precipitation of TJP1 pre‐mRNA in anti‐hnRNPL RIPs, using nuclear lysates from control and NTRAS‐CA16 motif overexpressing cells (n = 5 independent biological replicates). Representative western blot on the right.
- RT–PCR‐based analysis of TJP1 exon 20 inclusion upon NTRAS overexpression and overexpression of the NTRAS‐CA16 motif (n = 8 independent biological replicates).
- Endothelial resistance of NTRAS‐silenced HUVECs (n = 3–5 independent biological replicates), analyzed by electrical cell‐substrate impedance sensing (ECIS).
- Endothelial resistance of hnRNPL‐silenced HUVECs (n = 3 independent biological replicates), analyzed by ECIS.
- Analysis of TJP1 exon 20 inclusion by RT–PCR upon transfection of HUVECs with a control SSO or an SSO masking the exon 20–intron 20 boundary (E20 SSO) (n = 9 independent biological replicates). Representative agarose gel on the right. Schematic outline at the top right.
- Endothelial resistance of control SSO‐ or E20 SSO‐transfected HUVECs (n = 4 independent biological replicates), analyzed by ECIS.
Data information: In (B–J), data are represented as mean ± SEM. n.s.: non‐significant, *P < 0.05, **P < 0.01. (B, G–J) two‐tailed unpaired t‐test, (C–E) two‐tailed paired t‐test, and (F) one‐way ANOVA.
Source data are available online for this figure.
