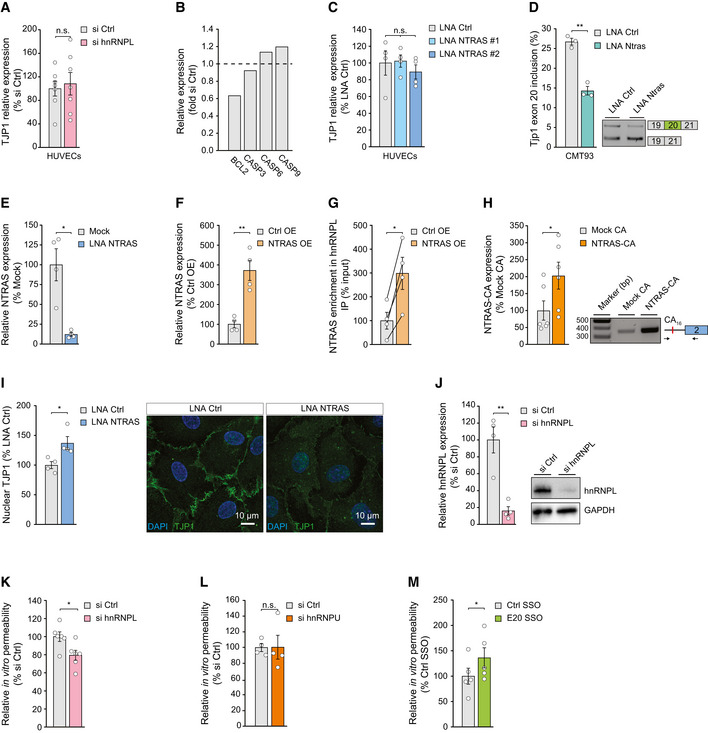
Figure EV3. NTRAS controls TJP1 splicing and endothelial barrier function.

- RT–qPCR‐based analysis of TJP1 mRNA expression in hnRNPL‐silenced HUVECs (n = 7 independent biological replicates).
- Relative expression of BCL2, CASP3, CASP6, and CASP9 mRNA in hnRNPL‐silenced HUVECs (n = 2 independent biological replicates).
- RT–qPCR‐based analysis of TJP1 mRNA expression in NTRAS‐silenced HUVECs (n = 4 independent biological replicates).
- RT–PCR‐based analysis of Tjp1 exon 20 inclusion in control and Ntras‐silenced murine CMT93 epithelial cells (n = 3 independent biological replicates).
- RT–qPCR‐based validation of RNase H‐mediated NTRAS degradation in HeLa nuclear extracts used for in vitro splicing (n = 4 independent biological replicates).
- RT–qPCR‐based validation of NTRAS overexpression (n = 4 independent biological replicates).
- Co‐precipitation of NTRAS in anti‐hnRNPL RIPs, using nuclear lysates from control and NTRAS‐overexpressing cells (n = 4 independent biological replicates).
- RT–PCR‐based validation of NTRAS‐CA16 motif overexpression (n = 6 independent biological replicates). Representative agarose gel on the right.
- Quantification of nuclear TJP1, comparing control and NTRAS‐silenced HUVECs (n = 4 independent biological replicates). Representative micrographs are shown. Scale bars are 10 µm.
- Analysis of hnRNPL knockdown by western blot 72 h post‐transfection of control or hnRNPL‐targeting siRNAs (n = 4 independent biological replicates). Representative western blots on the right.
- In vitro permeability assays using FITC‐dextran, comparing control and hnRNPL‐silenced HUVECs (n = 6 independent biological replicates).
- In vitro permeability assays using FITC‐dextran, comparing control and hnRNPU‐silenced HUVECs (n = 4 independent biological replicates).
- In vitro permeability assays using FITC‐dextran, comparing control SSO‐ and E20 SSO‐transfected HUVECs (n = 5 independent biological replicates).
Data information: In (A, C–M) data are represented as mean ± SEM. n.s.: non‐significant, *P < 0.05, **P < 0.01. (A–I) two‐tailed unpaired t‐test.
Source data are available online for this figure.
