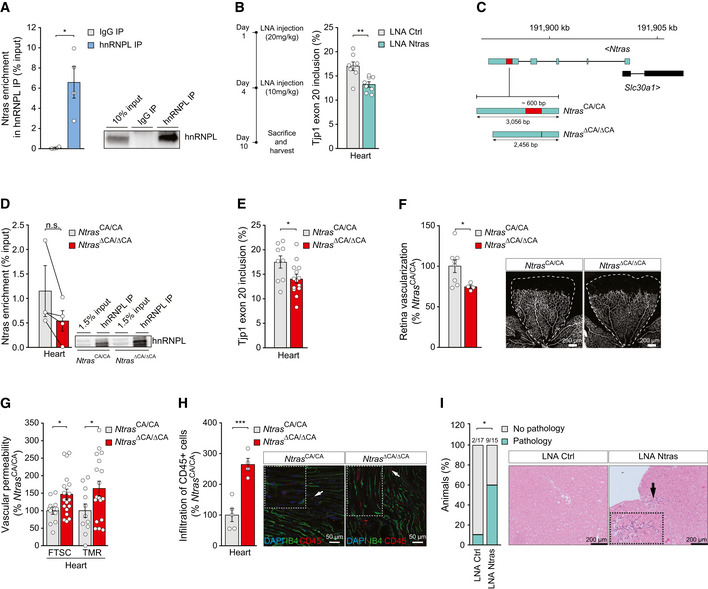
Figure 4. Ntras sustains vascular integrity in vivo .

- Validation of Ntras–hnRNPL interaction by anti‐hnRNPL RIPs from H5V lysates, followed by RT–qPCR (n = 4 independent biological replicates). Representative western blot on the right.
- RT–PCR‐based analysis of murine Tjp1 exon 20 inclusion in cardiac tissue from control and Ntras‐silenced mice (n = 8 mice per group). Experimental outline on the left.
- Illustration of the murine Ntras locus. Displayed are Ntras and Slc30a1 (GRCm38/mm10). The red box highlights the deleted genomic region (~600 bp) in Ntras ∆CA/∆CA mice, comprising the hnRNPL binding motif (~130 bp) and flanking sequences (~440 bp).
- Co‐precipitation of Ntras in anti‐hnRNPL RIPs using whole heart lysates from Ntras CA/CA and Ntras ∆CA/∆CA mice (n = 3–4 mice per group). Representative western blot on the right.
- RT–PCR‐based analysis of TJP1 exon 20 inclusion in hearts from Ntras CA/CA and Ntras ∆CA/∆CA mice (n = 9–14 mice per group).
- Retinal angiogenesis assessed in P7 Ntras CA/CA and Ntras ∆CA/∆CA pups by immunostaining of isolectin B4. Vascularized areas were normalized to total retinal area (n = 4–8 mice per group). Representative micrographs are shown. Scale bars are 200 µm.
- FTSC and TMR‐dextran in vivo permeability assays, comparing homogenates of hearts from Ntras CA/CA and Ntras ∆CA/∆CA mice. Data normalized to organ and body weight (n = 11–18 mice per group).
- Quantification of CD45+ cell (red) infiltration into cardiac tissue from Ntras CA/CA and Ntras ∆CA/∆CA mice normalized to DAPI. Isolectin B4 (green) was used to label endothelial cells (n = 4–5 mice per group). Representative micrographs are shown. Scale bars are 50 µm. Insets and arrows indicate sites of CD45+ cell infiltration.
- Percentage of control and Ntras‐silenced mice showing cardiac pathologies (n = 15–17 mice per group). Prevalence is indicated above the bars. H&E micrographs of murine heart sections from control and Ntras‐silenced mice are shown. Insets and arrows indicate sites of lymphocytic infiltration. Scale bars are 100 µm.
Data information: In (A, B, D–H), data are represented as mean ± SEM. n.s.: non‐significant, *P < 0.05, **P < 0.01, ***P < 0.001. (A) two‐tailed paired t‐test, (B, D–H) two‐tailed unpaired t‐test, and (I) Chi‐square test.
Source data are available online for this figure.
