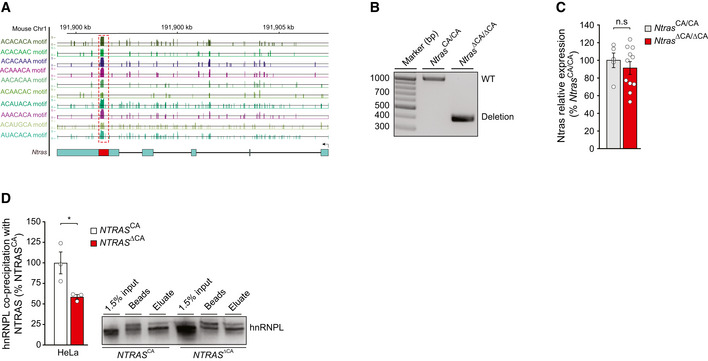
Figure EV4. Characterization of the Ntras CA‐repeat in vivo .

- Illustration of the murine Ntras locus. Displayed is Ntras (GRCm38/mm10; 1700034H15) and RBPmap‐predicted hnRNPL binding motifs, described elsewhere (Smith et al, 2013).
- Genotyping results confirming the genomic deletion of the hnRNPL binding motif in Ntras ∆CA/∆CA mice.
- RT–qPCR‐based analysis of Ntras expression in Ntras CA/CA and Ntras ∆CA/∆CA mice (n = 5–11 mice per group).
- Western blot‐based analysis of the NTRAS–hnRNPL interaction following antisense affinity selection of NTRAS in nuclear fractions from NTRAS CA controls and NTRAS ∆CA HeLa cells (n = 3 independent biological replicates). Representative western blot on the right.
Data information: In (C, D), data are represented as mean ± SEM. n.s.: non‐significant, *P < 0.05. (C, D) two‐tailed unpaired t‐test.
Source data are available online for this figure.
