-
A
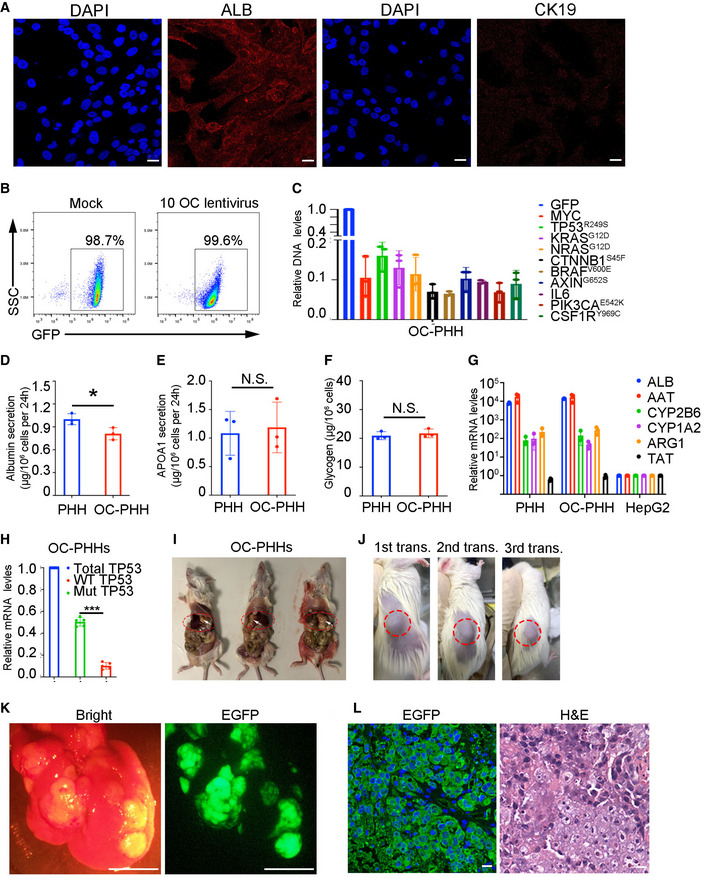
Commercial cryopreserved PHHs (PHH1, PHH4, and PHH5) were seeded in 6‐well plates and immunoassayed with antibodies that recognize ALB and KRT19. Scale bars, 20 μm.
-
B
Representative FACS analysis of PHHs that were transduced with a cocktail of 10 OC lentiviruses (right) or mock lentivirus (left).
-
C
qPCR assays measuring the transduction efficiencies of individual oncogenes using the genomic DNA samples of OC‐transduced PHHs. Relative copy numbers of DNA of oncogenes to the DNA of GFP. Data are presented as the mean ± SD (n = 3). N‐numbers refer to biological replicates.
-
D
The levels of albumin secretion in PHHs and OC‐transduced PHHs were measured by ELISA (n = 3), P = 0.0378 with unpaired t‐test, *P ≤ 0.05. Data are presented as the mean ± SD. N‐numbers refer to biological replicates.
-
E
The levels of APOA1 secretion in PHHs and OC‐transduced PHHs were measured by ELISA (n = 3), P > 0.05 with unpaired t‐test, data are presented as the mean ± SD, N.S. indicates non‐statistical significance. N‐numbers refer to biological replicates.
-
F
Glycogen storage was quantified by colorimetric in PHHs and OC‐transduced PHHs (n = 3 ), P > 0.05 with unpaired t‐test, data are presented as the mean ± SD. N.S. indicates non‐statistical significance. N‐numbers refer to biological replicates.
-
G
qPCR results of expression levels of hepatic genes in PHHs, OC‐transduced PHHs, and HepG2 cells on day 2 post‐transduction in culture (n = 3), data are presented as the mean ± SD. N‐numbers refer to biological replicates.
-
H
The expression levels of endogenous (WT) and mutant (Mut) TP53 in OC‐transduced PHHs (n = 5, P < 0.0001 with one‐way ANOVA by Tukey's multiple comparison test), ***P ≤ 0.001, data are presented as the mean ± SD. N‐numbers refer to biological replicates.
-
I
Mice with advanced intrahepatic tumor exhibited swollen and ascites‐containing abdomens, allowing detection of tumor burden by palpation. Tumors were pointed with white arrows.
-
J–L
Primary iHCC samples were harvested from mice from the OC group and were transplanted. 1 × 10⁶ iHCC cells were subjected for serial transplantations into NSI mice subcutaneously or splenically. Tumors were reconstituted post‐three rounds of subcutaneous transplantations of iHCC (J); Bright‐field and EGFP imaging of an explanted liver from a tumor‐bearing NSI mouse post splenic injection of iHCC cells. Scale bars, 0.5 cm (K); The anti‐GFP immunofluorescence and H&E staining of tumor dissection from a tumor‐bearing NSI mouse post splenic transplantation of iHCC. Scale bars, 20 μm (L).

