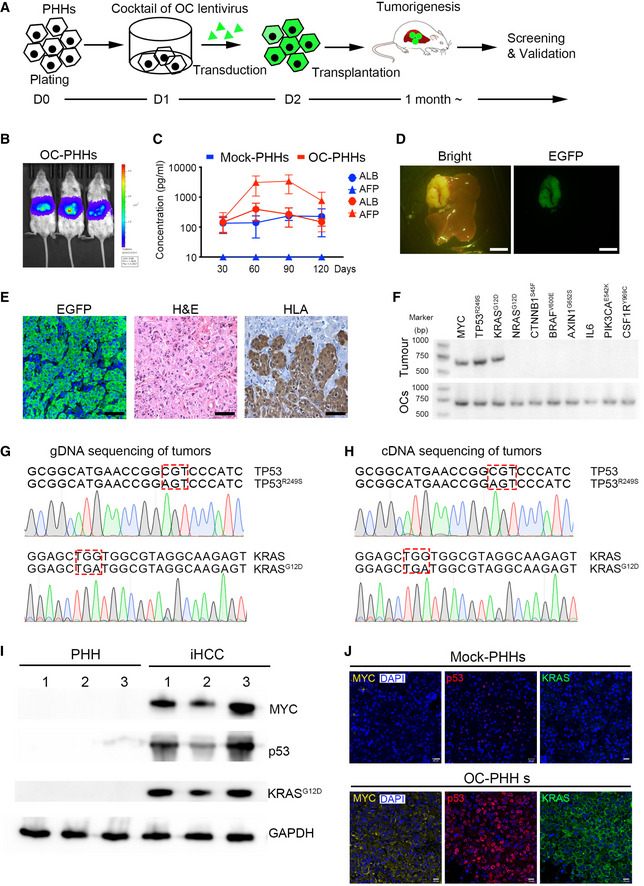
Figure 3. Screening of oncogenes involved in the transformation of PHHs into HCC cells.

-
ASchematic representation showing the process for induction of in situ HCC after lentiviral transduction of PHHs with a cocktail of 10 OC lentiviruses.
-
BBioluminescence imaging of three recipient NSIF mice (n = 3) that had been transplanted with OC‐transduced PHHs 4 months ago. The colors from blue to red indicate intrahepatic bioluminescence signal strength 4 months post‐transplantation of OC transduced PHHs.
-
CALB and AFP levels in sera from NSIF mice that were infused with OC‐transduced PHHs (OC‐PHHs) or EGFP‐transduced PHHs (mock‐PHHs) were measured by ELISA at indicated time points. (n = 5, the data are presented as the mean ± SD values. Two out of five mice died before 120 days post‐transplantation in the OC‐PHHs group. The levels of ALB and AFP in the rest three mice were measured.).
-
DBright and EGFP imaging of an explanted liver of a mouse from the OC group revealed an advanced intrahepatic tumor, Scale bars, 0.5 cm.
-
EAnti‐GFP immunofluorescence (left), H&E staining (center), anti‐HLA‐I IHC staining (right) images of tumor dissection from the OC group. Scale bars, 50 μm.
-
FRepresentative PCR amplification of MYC, TP53R249S, KRASG12D, NRASG12D, CTNNB1S45F, BRAFV600E, AXIN1G652S, IL6, PIK3CAE542K and CSF1RY969C in the genomic DNA of dissected primary tumors harvested from NSIF mice transplanted with OC‐PHHs (Tumor) and their corresponding overexpression vector plasmids as positive controls (OCs).
-
G, HGenomic DNA (gDNA) and cDNA of tumor samples were obtained for PCR amplification using forward primers that recognize TP53R249S or KRASG12D and reverse primers specific for EGFP. DNA sequencing confirmed mutations of TP53 and KRAS in the genomic DNA (G) and mRNA (H) of dissected primary tumors harvested from tumor‐bearing mice. Red squares indicate mutant codes in TP53R249S and KRASG12D .
-
IExpression of MYC, p53, and KRASG12D was detected in the iHCC samples (n = 3, biological replicates) by Western blotting. Cropped blots are shown.
-
JImmunofluorescence analysis of MYC, p53, and KRAS expression in iHCC samples derived from OC‐PHHs and normal humanized livers that were reconstituted with mock‐PHHs. Scale bars, 20 μm.
Source data are available online for this figure.
