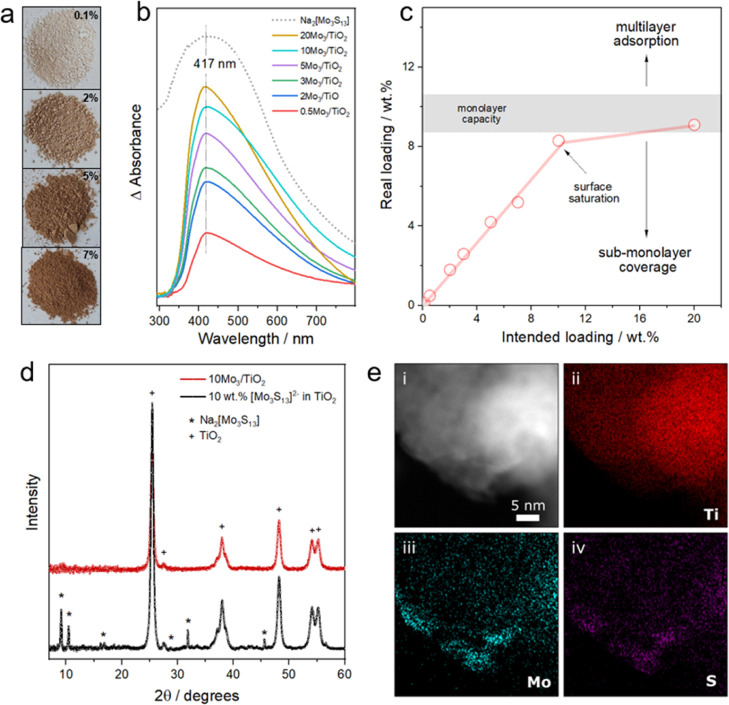
Figure 2.
Cluster immobilization. (a) Digital photographs of the xMo3/TiO2 samples with 0.1, 2, 5, and 7 wt % cluster loadings, (b) difference DRS spectra of the Mo3/TiO2 composites with different cluster loadings (0.1–20 wt %) subtracted from TiO2 absorption (see details in Supporting Information, methods) along with the DRS spectrum of Na2[Mo3S13] (dashed line), (c) real vs intended loading plot depicting the range of theoretical monolayer capacity (see details in Supporting Information, Section 6), a linear increase between the real and intended loadings for loadings <9 wt % and its saturation at higher loadings. (d) XRD pattern of Mo3/TiO2 composites (10 wt % loading) and of a physical mixture of Na2[Mo3S13] and TiO2 (1:9 wt %), (e) EDS-derived elemental mappings of Ti (ii), Mo (iii), and S (iv) in an exemplary 3Mo3/TiO2 composite.

