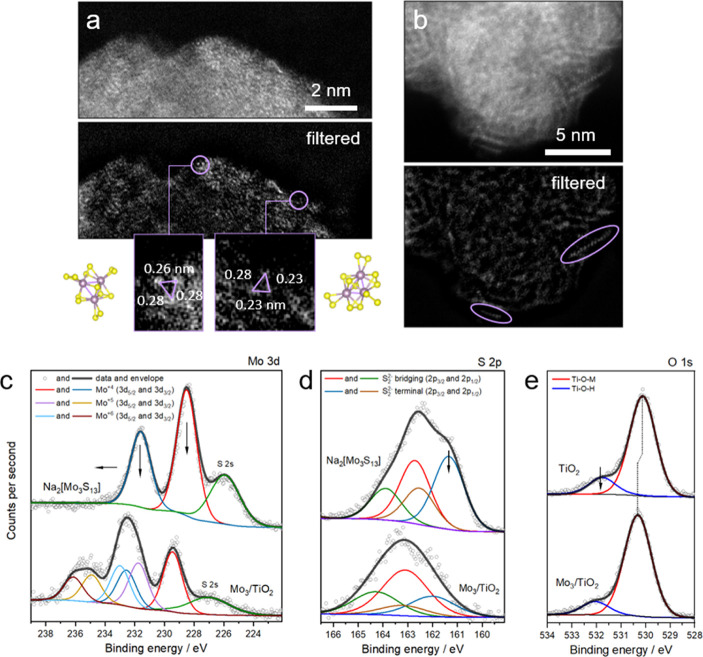
Figure 3.
Cluster attachment. (a,b) HAADF-STEM images of 3Mo3/TiO2 composites; Fourier filtered images are shown in the bottom panels; examples of detected {Mo3} cores are circled and magnified in the insets in (a), where they are compared with the model of tilted [Mo3S13]2– cluster cores, (c–e) XPS spectra of the Na2[Mo3S13] and the clusters after attachment to the TiO2 surface (c) Mo 3d region, (d) S 2p, and (e) O 1s regions with corresponding fits; real [Mo3S13]2– loading is derived via TXRF to be 2 wt %.

