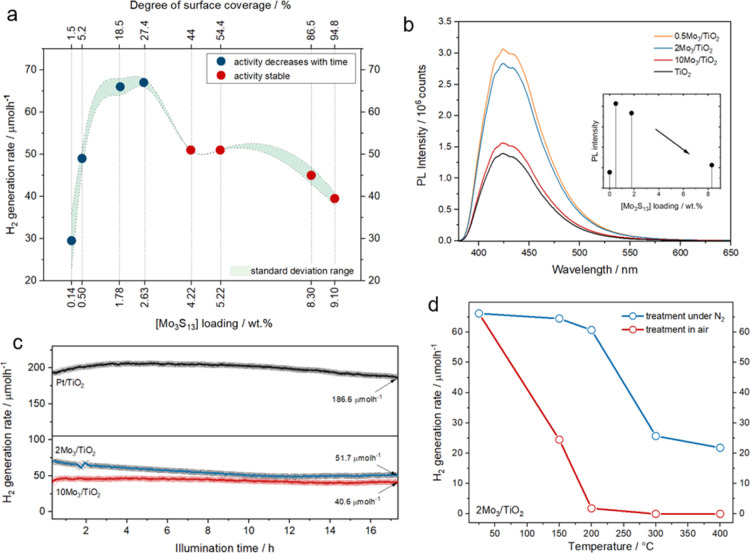
Figure 4.
Photocatalytic performance and active sites. (a) Hydrogen evolution rates plotted against the [Mo3S13]2– cluster content and the degree of surface coverage in %; green area shows the standard deviation of hydrogen evolution rate values obtained from multiple measurements for each loading value, (b) PL spectra obtained from the catalyst solutions containing TA as OH trap after UV pre-illumination; inset shows intensities of the peak maximum (ca. 425 nm corresponding to hydroxyterephthalic acid emission) plotted against the real [Mo3S13]2– loadings, (c) long-term photocatalytic hydrogen evolution experiments of Mo3/TiO2 composites with 2 and 10 wt % loadings and their comparison with Pt/TiO2 in terms of HER stability, (d) comparison of the hydrogen generation rate of Mo3/TiO2 composites heat-treated (25–400 °C) under air and the N2 atmosphere; full HER profiles are shown in Figures S12 and S19.

