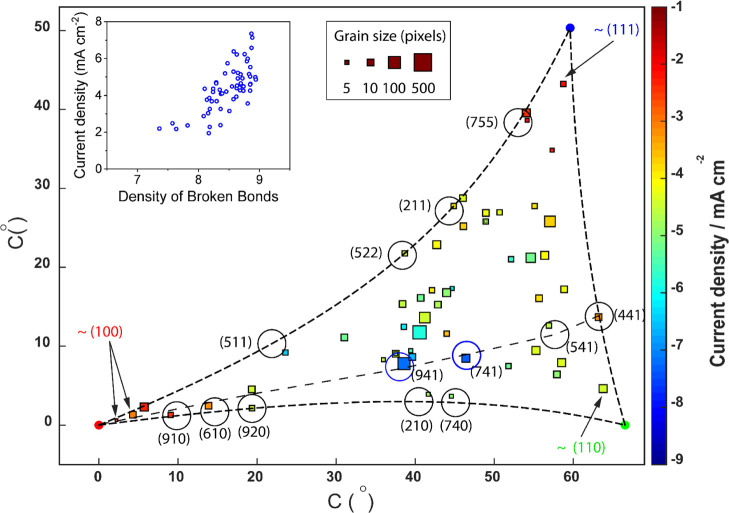
Figure 3.
Two-dimensional projection of Cu grain orientations in an fcc crystal system correlated with electrochemical data from SECCM. Grain-resolved electroreduction current density measurements at Esurf = −1.05 V vs Ag/AgCl (extracted from the SECCM scan in Figure 2 and Movie S1) plotted vs the corresponding average grain orientation relative to the low-index orientation poles. The size of each data point is proportional to the number of SECCM pixels of that orientation according to the displayed scale. Further details of each grain within the plot can be found in Supporting Information, Table S1 (Section S4). Arrows point to the data points closest to the three low-index facets that were chosen to represent (100), (111), and (110) grains in Figure 2. Dashed lines at the boundaries and the bisecting path across the triangle cover various high-index crystallographic structures. Along these lines, the projected coordinates for specific high-index orientations are identified with black circles of a diameter of 3.0° in the projection coordinates. Hence, a data point in or on a drawn circle is considered to represent grains identical to (or within ±1.5 degrees of) the indicated orientation, with the Miller index written next to the circle. Cu(941) and Cu(741) facets are emphasized in blue. The inset shows the relationship between measured current density on the 60 grains and density of broken bonds. Detail of the calculation is provided in Supporting Information, Section S5.

