Figure 5.
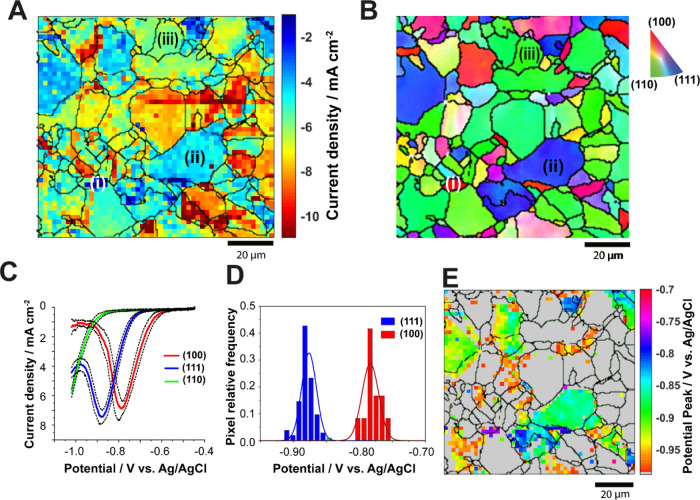
(A) Electrochemical image of the measured current density on a polycrystalline Cu surface, extracted from the potentiodynamic SECCM movie (Movie S3) at E = −1.05 V vs Ag/AgCl. (B) Co-located EBSD map. The scan covers a 100 × 100 μm2 area comprising 2500 pixels. SECCM mapping was conducted with a nanopipette filled with 10 mM KHCO3 in a CO2 environmental cell. (C) Averaged linear sweep voltammograms collected on low-index grains [(100), (111), and (110)] which are identified as (i, ii, and iii) in (A) and (B). Shown on linear sweep voltammograms are the average current density–voltage curves (solid lines) ± one standard deviation (dotted lines), obtained from 13, 78, and 39 independent linear sweep voltammograms selected from grains (100), (111), and (110), respectively. (D) Histograms of peak position values for the Cu(111) and (100) LSV data from (C). (E) Spatially resolved peak potential map, extracted from individual linear sweep voltammograms. In this map, pixels with peakless linear sweep voltammograms are colored gray.

