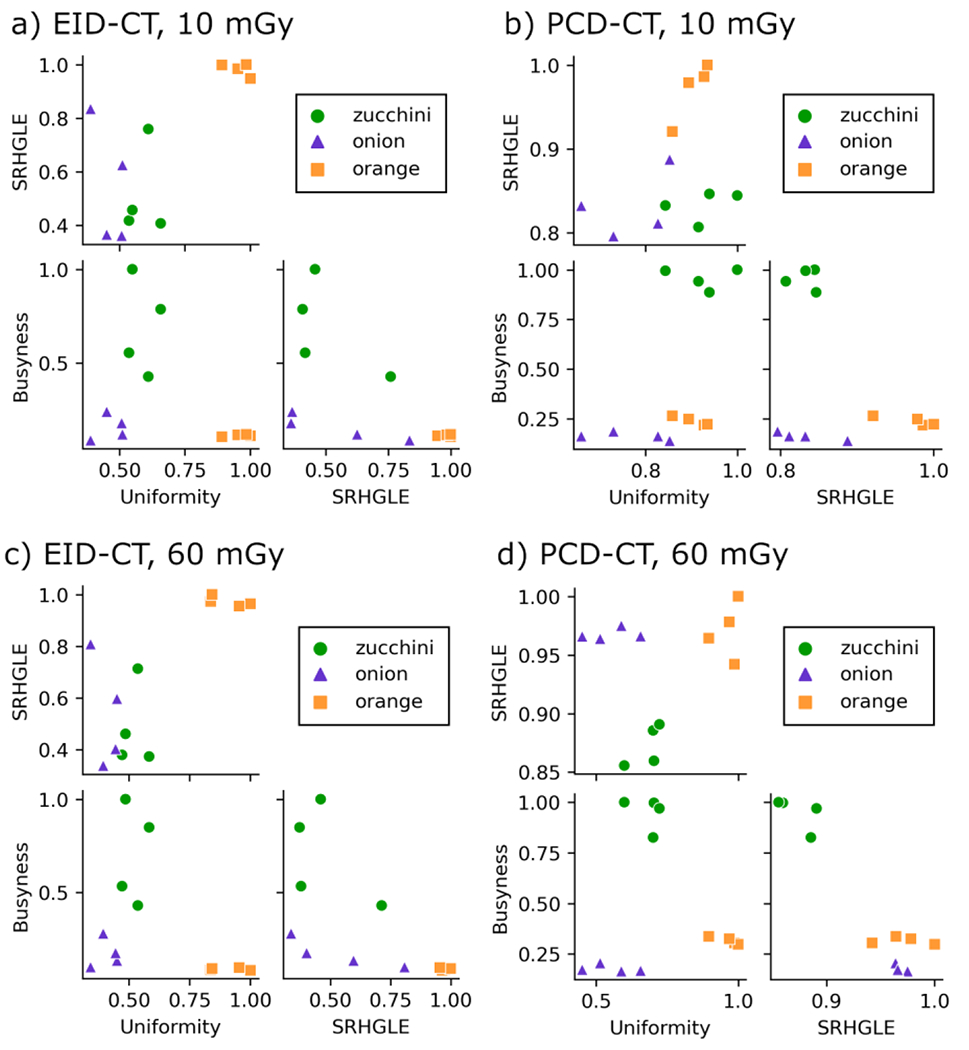
Figure 4.

Pair plots of three radiomic features (Uniformity, Busyness, and Short Run High Gray Level Emphasis (SRHGLE)) whose data points form clusters representing zucchini, onion, and oranges. Many clusters appear smaller and more separated in features derived from PCD-CT images compared to EID-CT images.
