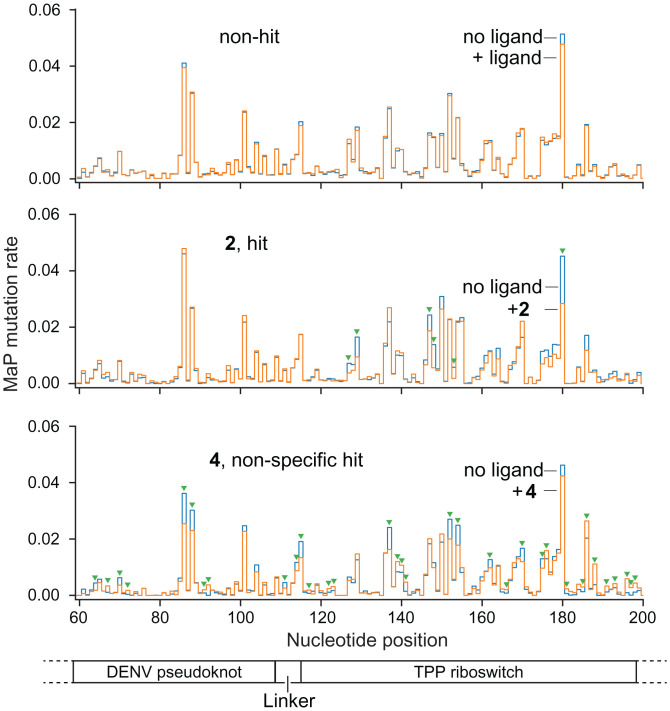
Fig. 2.
Representative SHAPE mutation rate comparisons for fragment hits and nonhits. Normalized mutation rates for fragment-exposed samples (orange) are compared to no-ligand traces (blue). Statistically significant changes in mutation rate are denoted with green triangles (see SI Appendix, Fig. S2 for SHAPE confirmation data). (Top) Mutation rate comparison for a representative fragment that does not bind the test construct. (Middle) Fragment hit to the TPP riboswitch region of the RNA. (Bottom) Nonspecific hit that induces reactivity changes across the entire test construct. RNA motif 1 and 2 landmarks are shown below SHAPE profiles.

