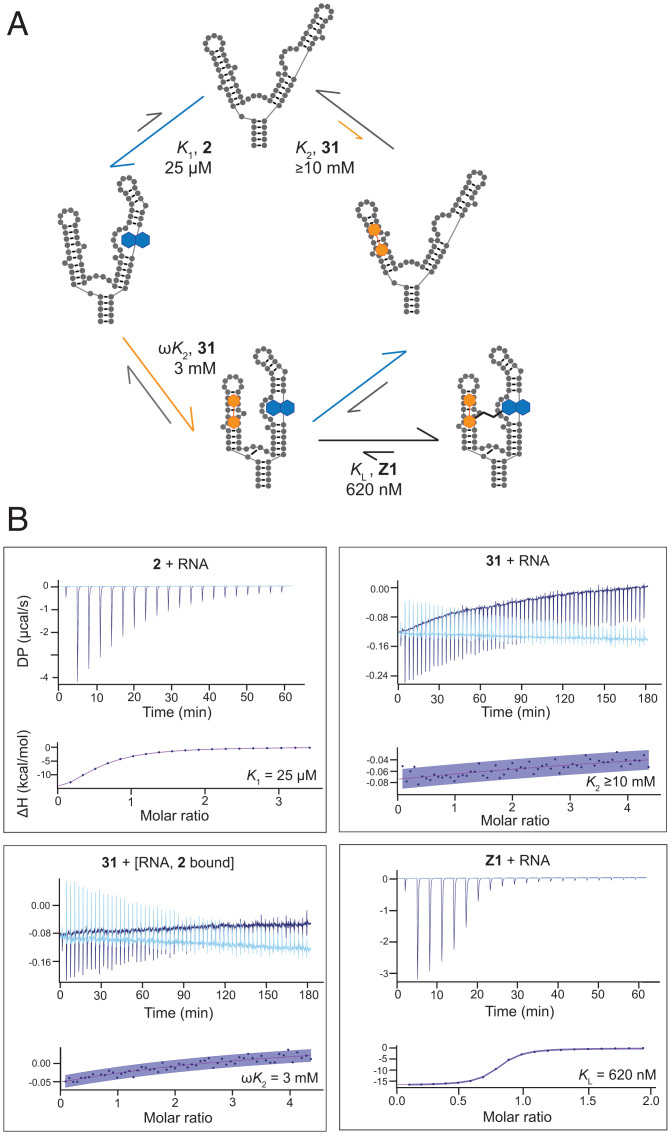
Fig. 4.
Thermodynamic cycle and stepwise ligand binding affinities for fragments 2 and 31. (A) Summary of binding by 2 (blue, K1) and 31 (orange, K2) fragments and the linked compound Z1. Kd values determined by ITC. (B) Representative ITC data showing single-compound and cooperative binding by 2 and 31. Linking the two fragments shows an additive effect in binding energies, resulting in a submicromolar ligand, Z1 (KL). ITC traces are shown with experimental traces in dark blue and background traces (ligand titrated into buffer) as light blue. Confidence intervals (95%) are in purple shading.

