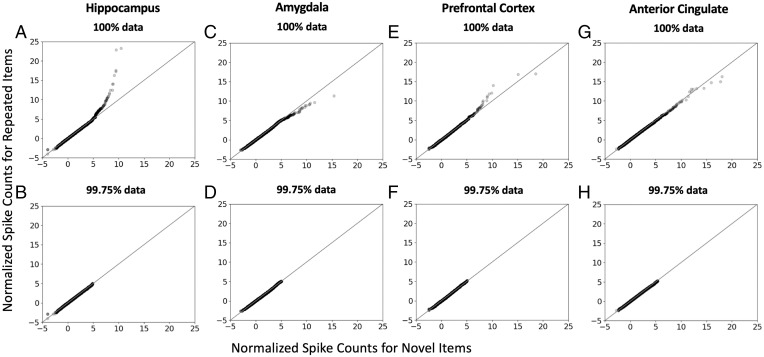
Fig. 2.
QQ plots of the normalized spike counts in response to novel words (x-axis) and repeated words (y-axis) for the hippocampus (A and B), amygdala (C and D), prefrontal cortex (E and F), and anterior cingulate (G and H). Top panels plot 100% of the data for each region (hippocampus: 77,431 recordings; amygdala: 65,219 recordings; prefrontal: 47,399 recordings; anterior cingulate: 62,205 recordings). The dark symbols indicate high-density data points, representing thousands of recordings; the light symbols indicate low-density data points, representing a very small percentage of recordings. Bottom panels show the same data after removing the 0.25% recordings with the highest spike counts from both the novel-word and repeated-word distributions. For the hippocampus, the points fell mostly along the diagonal line but exhibited a sharp upward deflection (A), indicating that some neurons responded strongly to some repeated words. After removing the top 0.25% of the data, the upward deflection for the hippocampus disappeared (B), indicating that only a very small percentage of neurons spiked more in response to repeated words than novel words. By contrast, the plots for the other three regions did not exhibit similar upward deflections. Thus, the activity pattern signaling episodic memory was identified only in the hippocampus.

