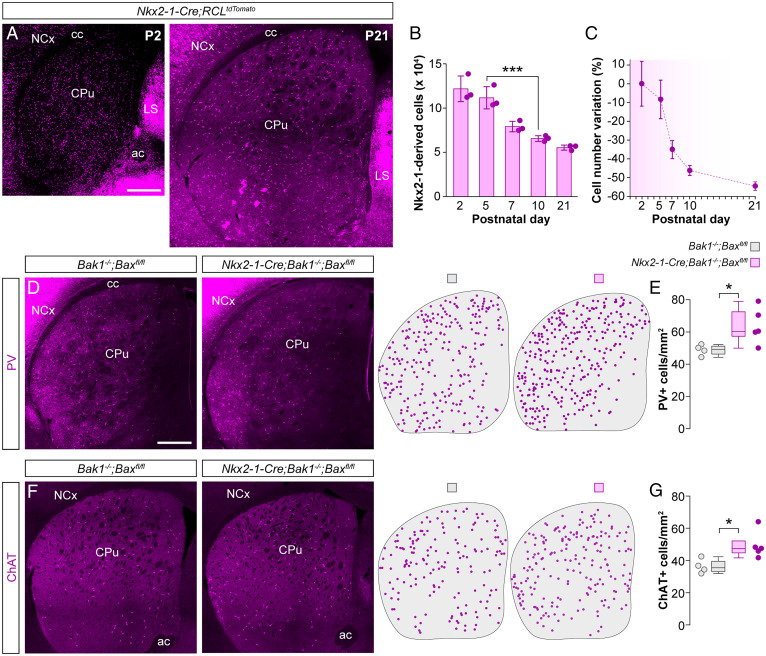
Fig. 1.
Striatal interneurons undergo programmed cell death during early postnatal development. (A) Coronal sections through the striatum of Nkx2-1-Cre;RCLtdTomato mice at P2 and P21. (B) Stereological estimates of the total number of tdTomato+ neurons in the striatum of Nkx2-1-Cre;RCLTdTomato mice at different postnatal stages (n = 3 mice per postnatal stage); one-way ANOVA, ***P < 0.001; P2 vs. P5: Tukey–Kramer HSD test, P > 0.05; P5 vs. P10: Tukey–Kramer HSD test, ***P < 0.001. (C) Percentage variation in the number of tdTomato+ cells at different postnatal stages relative to the average number of tdTomato+ cells at P2. (D and F) Coronal sections through the striatum of control Bak1−/−;Baxfl/fl and mutant Nkx2-1-Cre;Bak1−/−;Baxfl/fl mice immunostained for PV (D) and ChAT (F). The schematic dot maps indicate the locations of striatal interneurons in each case. (E and G) Quantification of PV+ (E) and ChAT+ (G) interneuron density in the striatum of control Bak1−/−;Baxfl/fl (n = 4) and mutant Nkx2-1-Cre;Bak1−/−;Baxfl/fl (n = 5) mice. PV+ interneurons: two-tailed unpaired Student’s t test, *P < 0.05. ChAT+ interneurons: Wilcoxon’s rank-sum test, *P < 0.05. Data in B are shown as bar plots and data in E and G as box plots. Adjacent data points indicate the stereological estimate in each mouse (B) or the average cell density in each animal (E and G). Error bars indicate SD. (Scale bars, 500 µm.).

