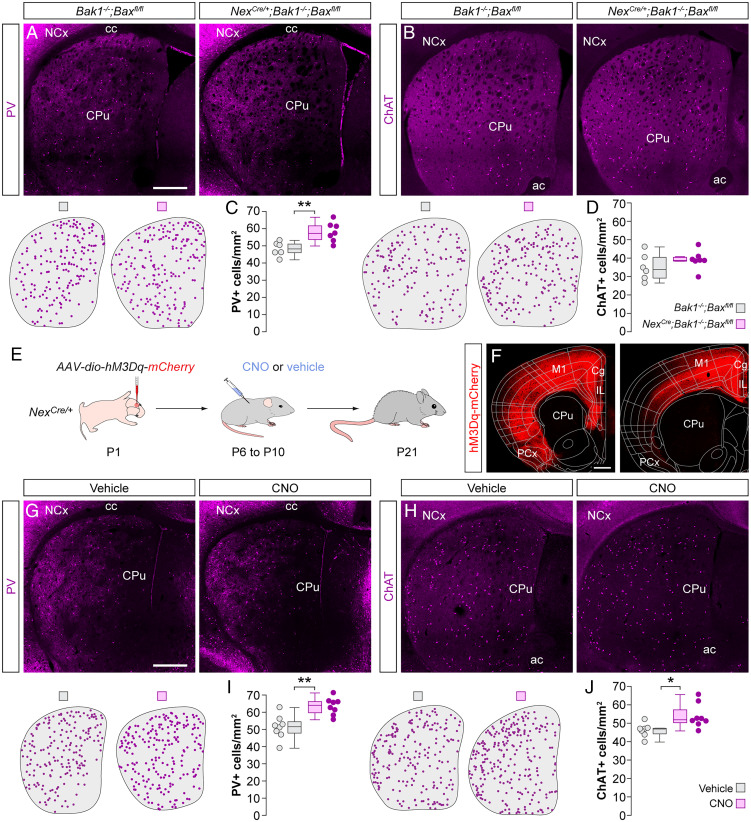
Fig. 2.
Cortical gain-of-function rescues striatal PV+ and ChAT+ interneurons. (A and B) Coronal sections through the striatum of control Bak1−/−;Baxfl/fl mice and mutant NexCre/+;Bak1−/−;Baxfl/fl mice immunostained for PV (A) and ChAT (B). The schematic dot maps indicate the locations of striatal interneurons in each case. (C and D) Quantification of PV+ (C) and ChAT+ (D) interneuron density in the striatum of control Bak1−/−;Baxfl/fl (n = 6) and mutant NexCre/+;Bak1−/−;Baxfl/fl (n = 7) mice. PV+ interneurons: two-tailed unpaired Student’s t test, **P < 0.01. ChAT+ interneurons: two-tailed unpaired Student’s t test, P = 0.27. (E) Schematic of experimental design. (F) Coronal sections through the brain at ∼1.5 mm (Left) and ∼0.5 mm (Right) anterior to Bregma reveal the extent of the viral infection. The images have been overlaid with the corresponding coronal maps. (G and H) Coronal sections through the striatum of vehicle- and CNO-treated NexCre/+ mice immunostained for PV (G) and ChAT (H). The schematic dot maps indicate the locations of striatal interneurons in each case. (I and J) Quantification of PV+ (I) and ChAT+ (J) interneuron density in the striatum of vehicle (n = 8 for PV and 7 for ChAT)- and CNO-treated (n = 8) NexCre/+ mice. PV+ interneurons: two-tailed unpaired Student’s t test, **P = 0.01. ChAT+ interneurons: two-tailed unpaired Student’s t test, *P < 0.05. Data in C, D, I, and J are shown as box plots and the adjacent data points indicate the average cell density in each animal. (Scale bars, 500 µm.).

