Fig. 3.
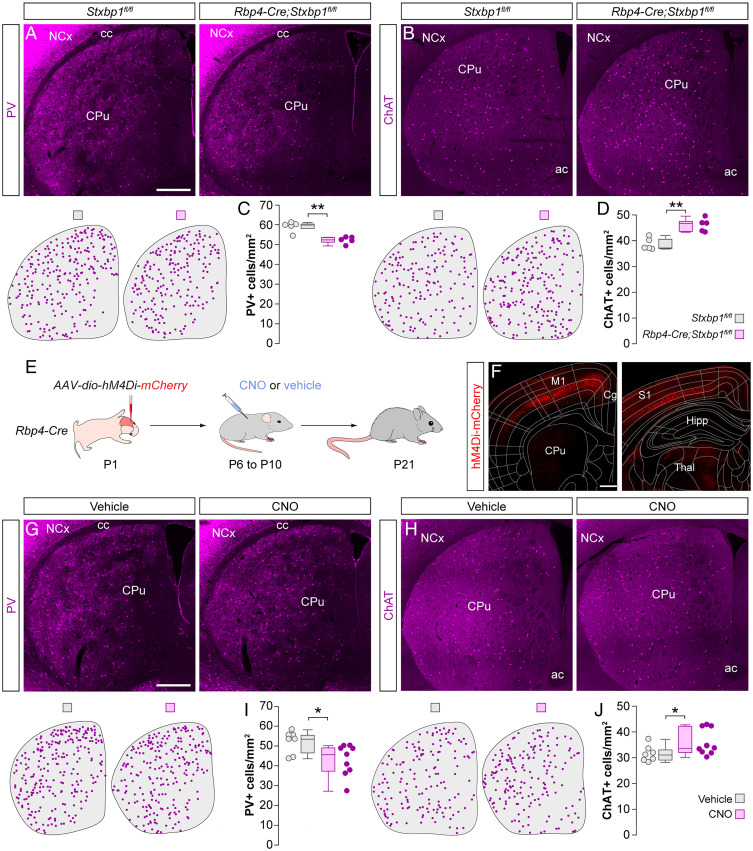
Cortical dysfunction differentially impacts the survival of striatal PV+ and ChAT+ interneurons. (A and B) Coronal sections through the striatum of control Stxbp1fl/fl mice and mutant Rbp4-Cre;Stxbp1fl/fl mice immunostained for PV (A) and ChAT (B). The schematic dot maps indicate the locations of striatal interneurons in each case. (C and D) Quantification of PV+ (C) and ChAT+ (D) interneuron density in the striatum of control Stxbp1fl/fl (n = 5) and mutant Rbp4-Cre;Stxbp1fl/fl (n = 5) mice. PV+ interneurons: Wilcoxon’s rank-sum test, **P < 0.01. ChAT+ interneurons: two-tailed unpaired Student’s t test, **P < 0.01. (E) Schematic of experimental design. (F) Coronal sections through the brain at ∼1 mm anterior (Left) and ∼2 mm posterior (Right) to Bregma reveal the extent of the viral infection. The images have been overlaid with the corresponding coronal maps. (G and H) Coronal sections through the striatum of vehicle- and CNO-treated Rbp4-Cre mice immunostained for PV (G) and ChAT (H). The schematic dot maps indicate the locations of striatal interneurons in each case. (I and J) Quantification of PV+ (I) and ChAT+ (J) interneuron density in the striatum of vehicle (n = 7)- and CNO-treated (n = 9) Rbp4-Cre mice. PV+ interneurons: two-tailed unpaired Student’s t test, *P < 0.05. ChAT+ interneurons: Wilcoxon’s rank-sum test, *P = 0.05. Data in C, D, I, and J are shown as box plots and the adjacent data points indicate the average cell density in each animal. (Scale bars, 500 µm.).

