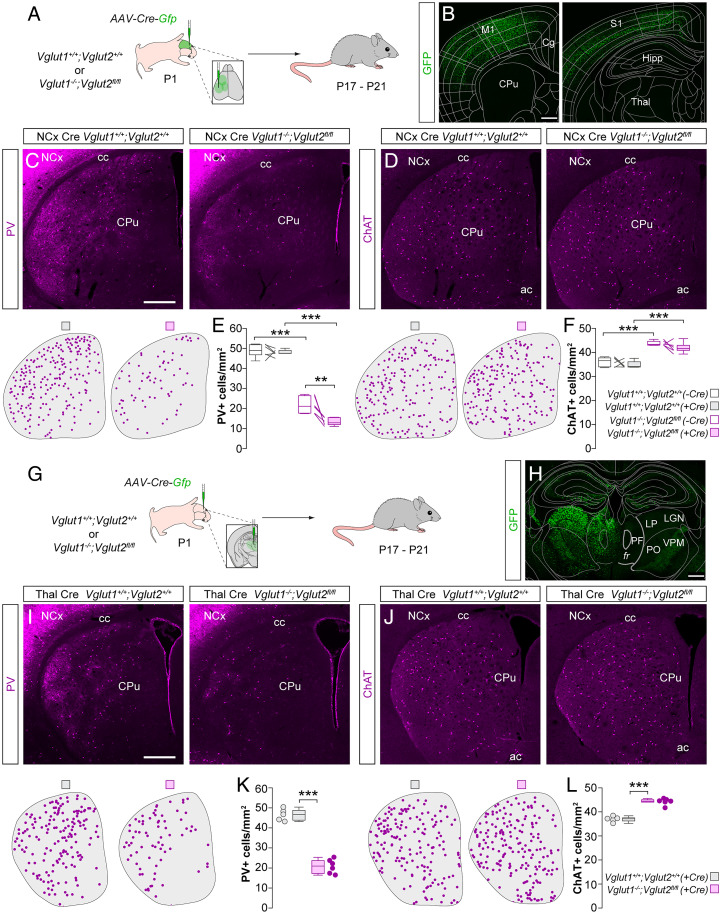
Fig. 4.
Long-range glutamatergic inputs regulate striatal interneuron survival. (A) Schematic of experimental design. (B) Coronal sections through the brain at ∼1 mm anterior (Left) and ∼2 mm posterior (Right) to Bregma reveal the extent of the viral infection. The images have been overlaid with the corresponding coronal maps. (C and D) Coronal sections through the striatum of Cre-injected control Vglut1+/+;Vglut2+/+ and double-mutant Vglut1−/−;Vglut2 fl/fl mice immunostained for PV (C) and ChAT (D). The schematic dot maps indicate the locations of striatal interneurons in each case. (E and F) Quantification of PV+ (E) and ChAT+ (F) interneuron density in the striatum of Cre-injected (+Cre) and uninjected (−Cre) hemispheres of control Vglut1+/+;Vglut2+/+ (n = 6) and double-mutant Vglut1−/−;Vglut2 fl/fl (n = 6) mice. PV+ interneurons: two-way ANOVA, ***P < 0.001; −Cre control vs. −Cre double mutant, Tukey–Kramer HSD test, ***P < 0.001; +Cre control vs. +Cre double mutant, Tukey–Kramer HSD test, ***P < 0.001; −Cre double mutant vs. +Cre double mutant, Tukey–Kramer HSD test, **P < 0.01. ChAT+ interneurons: two-way ANOVA, ***P < 0.001; −Cre control vs. −Cre double mutant, Tukey–Kramer HSD test, ***P < 0.001; +Cre control vs. +Cre double mutant, Tukey–Kramer HSD test, ***P < 0.001; −Cre double mutant vs. +Cre double mutant, Tukey–Kramer HSD test, P = 0.31. (G) Schematic of experimental design. (H) Coronal section through the brain at ∼2 mm posterior to Bregma reveals the extent of the viral infection. The image has been overlaid with the corresponding coronal map. (I and J) Coronal sections through the striatum of Cre-injected control Vglut1+/+;Vglut2+/+ and double-mutant Vglut1−/−;Vglut2 fl/fl mice immunostained for PV (I) and ChAT (J). The schematic dot maps indicate the locations of striatal interneurons in each case. (K and L) Quantification of PV+ (K) and ChAT+ (L) interneuron density in the striatum of Cre-injected (+Cre) hemispheres of control Vglut1+/+;Vglut2+/+ (n = 5) and double-mutant Vglut1−/−;Vglut2 fl/fl (n = 6) mice. PV+ interneurons: two-tailed unpaired Student’s t test, ***P < 0.001. ChAT+ interneurons: two-tailed unpaired Student’s t test, ***P < 0.001. Data in E, F, K, and L are shown as box plots and the adjacent data points indicate the average cell density in each animal. (Scale bars, 500 µm.) Abbreviations: FR, fasciculus retroflexus; PF, parafascicular nucleus; LP, lateral posterior nucleus; LGN, lateral geniculate nucleus; PO, posterior medial nucleus; VPM, ventral posteromedial nucleus.

