Fig. 1.
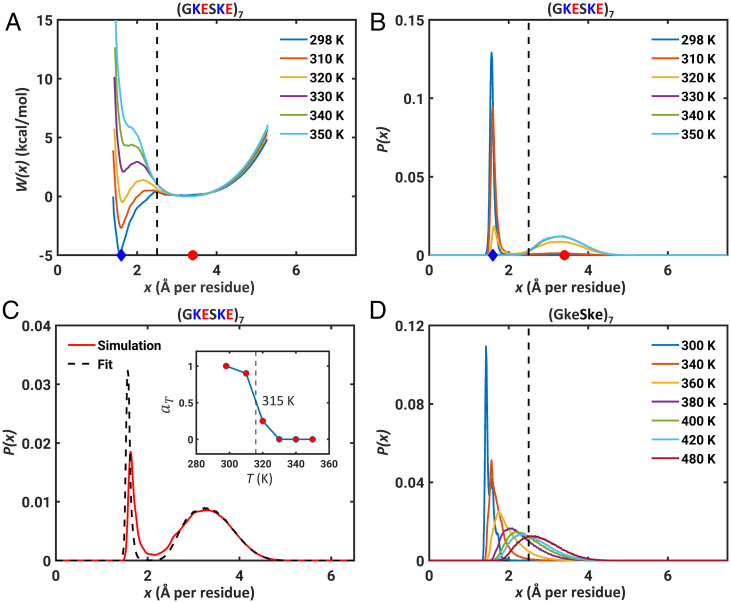
Neutral polyampholytic IDPs show two-state behavior. (A) The free energy profile W(x) for (GKESKE)7 calculated for different simulation temperatures. (B) Probability distribution functions P(x) obtained from the free energy profiles show the presence of two distinct peaks corresponding to the distinct minima in A. The dashed line in A and B indicates the reference length scale of xFRC = 2.5 Å per residue. In each of the panels, the blue diamonds and red circles mark positions of xglobule and xSAW, respectively. (C) The bimodal distribution P(x) can be fit to a two-state model (see main text). The fit is shown here for an intermediate simulation temperature of 320 K. (Inset) aT as a function of temperature and the dashed vertical line corresponds to T = 315 K, where aT ≈ 0.5. (D) The distributions P(x) for the neutral polymer lacking charged residues change continuously as temperature increases. Note the existence of temperatures where distributions can be peaked around xFRC, which is not the case for the parent sequence (GKESKE)7 that has charged residues.

