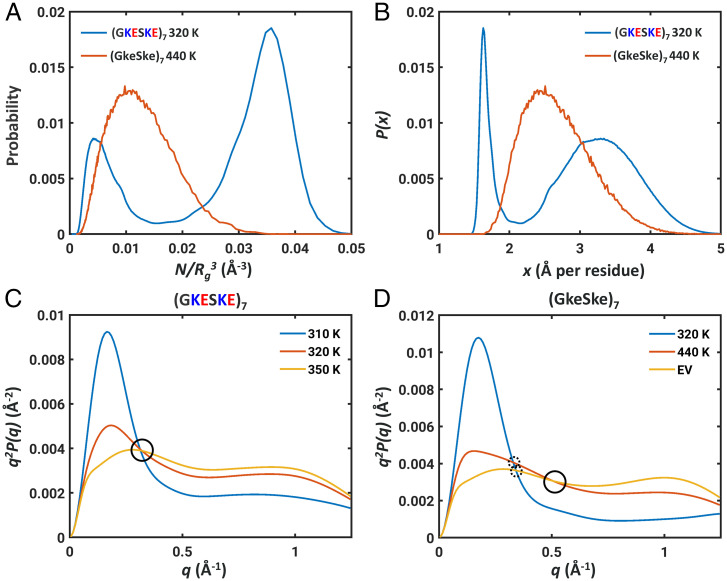
Fig. 2.
Rg distributions and Kratky profiles at the apparent theta temperature for two types of systems where the scaling exponents would be 0.5. (A) Differences in Rg distributions, plotted as distributions of effective concentrations at the apparent theta temperatures for (GKESKE)7 (blue) vs. (GkeSke)7 (red). (B) Differences in distributions of x, the normalized Rg distributions between the two systems at their respective apparent theta temperatures. The bimodality of a bistable system is replaced by a Gaussian behavior for a system that lacks charged residues. (C) Kratky profiles for globules (blue), coils (red), and self-avoiding walks (yellow) for (GKESKE)7 computed at the relevant temperatures. The single cross-over length scale is circled for ease of identification. (D) Kratky profiles for globules (blue), coils (red), and self-avoiding walks (yellow) for (GKESKE)7 computed at the relevant temperatures. Noncoincidence of cross-over length scales is shown as dashed circles, and the presence of an additional cross-over length scale is identified using a solid circle.

