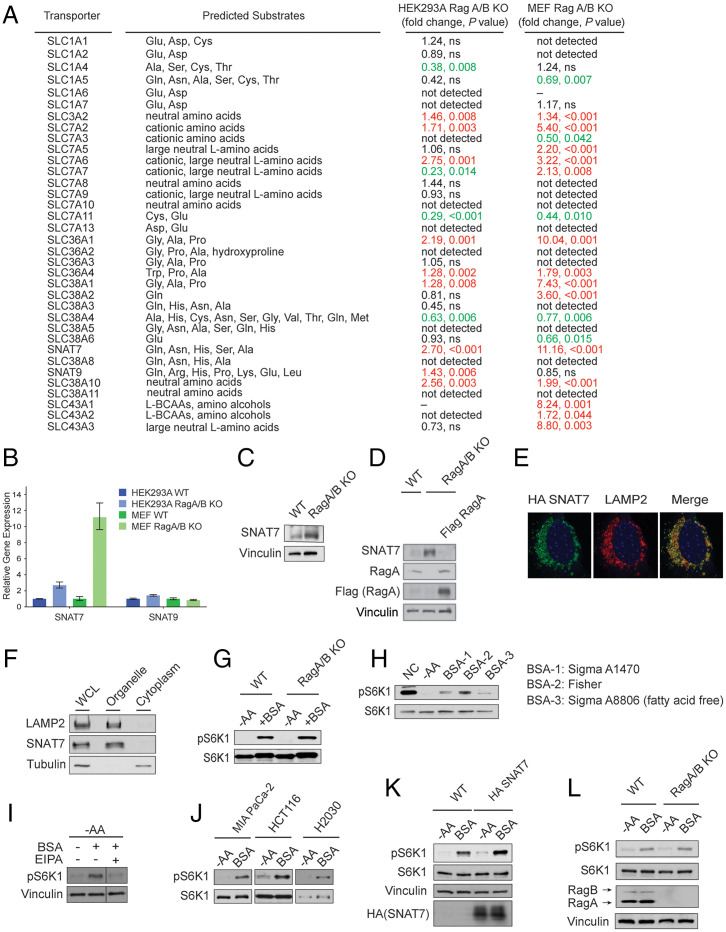
Fig. 1.
SNAT7 is elevated and promotes mTORC1 signaling in the absence of the Rag GTPases. (A) Table summarizing mRNA levels of solute carrier transporters in wild-type (WT) and RagA/B knockout (KO) human embryonic kidney 293A (HEK293A) and mouse embryonic fibroblast (MEF) cells. P values were determined by Student’s t tests. P values greater than 0.05 were labeled as not significant (ns). Red text denotes increase in expression, whereas green text denotes a decrease in expression. mRNA levels that were not determined due to bad performance of primers were labeled as “–”. (B) Expression of SNAT7 and SNAT9 in WT and RagA/B KO HEK293A and MEF cells. mRNA levels of SNAT7 and SNAT9 were determined in WT or RagA/B KO MEF or HEK293A cells by real-time quantitative PCR. See (A) for P values. (C) SNAT7 expression is elevated in Rag A/B KO MEF cells. Protein levels of SNAT7 in WT or RagA/B KO MEFs were determined by Western blotting. Vinculin was used as a loading control. (D) Protein levels of SNAT7 in WT, Rag A/B KO MEFs, or Rag A/B KO MEFs stably expressing Flag-tagged Rag A were determined by Western blotting. RagA and Flag-tagged RagA were blotted for as controls. Vinculin was used as a loading control. (E) SNAT7 localizes to the lysosome, shown by immunofluorescence analysis depicting HA-tagged SNAT7 (green) and the lysosomal marker LAMP2 (red). (F) Subcellular fractionation experiments in HEK293A cells were performed separating the organelle and cytoplasmic fraction. SNAT7, LAMP2 (lysosomal marker), and Tubulin (cytoplasmic marker) were immunoblotted. (G) Bovine serum albumin (BSA) activates mTORC1 in the absence of the Rag GTPases. WT or RagA/B KO MEF cells were starved of amino acids (−AA) for 2 h and then stimulated with 3% BSA for 2 h. mTORC1 activity was analyzed by immunoblotting for the phosphorylation status of S6K1 (pS6K1) at threonine 389. S6K, actin, and vinculin were used as loading controls. (H) mTORC1 is activated by BSA. MIA PaCa-2 cells were starved of amino acids (−AA) for 2 h and then stimulated with different BSA (3%) for 4 h. mTORC1 activity was analyzed as described in (G). (I) BSA activates mTORC1 through macropinocytosis. MIA PaCa-2 cells were starved of amino acids (−AA) for 2 h and then stimulated with BSA (3%) for 4 h. Macropinocytosis inhibitor EIPA (25 μM) or DMSO as a control was maintained for the whole period of the starvation and stimulation process. mTORC1 activity was analyzed as described in (G). (J) BSA activates mTORC1 in pancreatic, colon, and lung cancer cell lines. Pancreatic (MIA PaCa-2), colon (HCT116), or lung (H2030) cancer Ras transformed cells were starved for amino acids (−AA) for 2 h followed by 3% BSA stimulation for 2 h (in HCT116) or 4 h (in MIA PaCa-2 and H2030). mTORC1 activity was analyzed as described in (G). (K) Expression of SNAT7 enhances BSA-induced mTORC1 activation. WT or HA-tagged SNAT7 stably expressed MIA PaCa-2 cells were starved of amino acids (−AA) for 2 h and then stimulated with 3% BSA for 4 h. mTORC1 activity was analyzed as described in (G). S6K1 and vinculin were used as loading controls. HA-tagged SNAT7 overexpression was confirmed by Western blotting. (L) Albumin signals to mTORC1 in the absence of the Rag GTPases. MIA PaCa-2 cells were starved of amino acids (−AA) for 2 h and then stimulated with 3% BSA for 4 h. mTORC1 activity was analyzed as described in (G). RagA/B levels were confirmed using Western blotting. Vinculin and S6K were used as loading controls.

