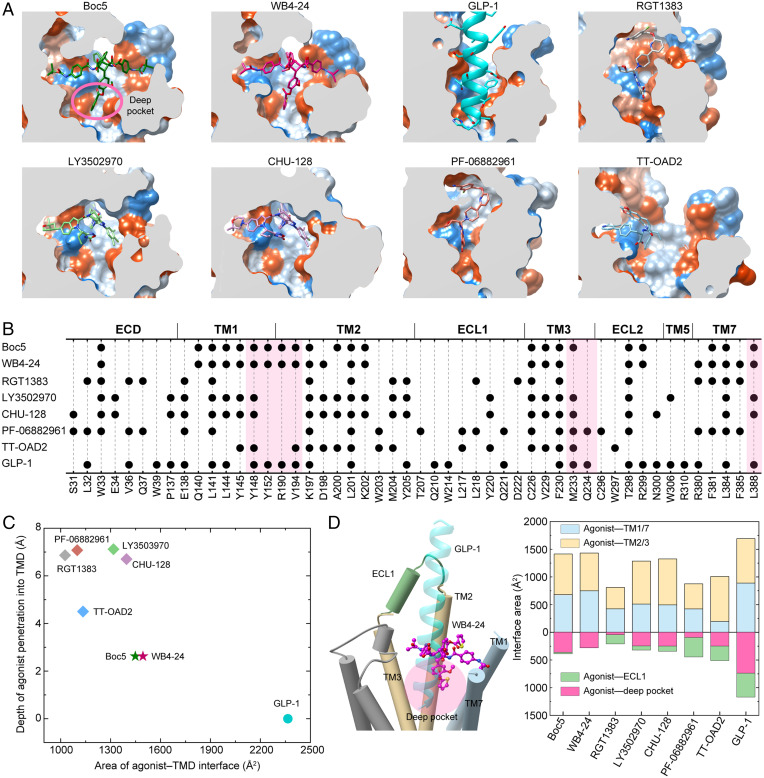
Fig. 4.
Peptidomimetic binding mode of Boc5 and WB4-24. (A) Structural comparison of the binding conformations of peptidic and nonpeptidic agonists of GLP-1R. The receptor is shown in surface representation and colored from dodger blue for the most hydrophilic region to white, and to orange-red for the most hydrophobic region. Small-molecule agonists and GLP-1 are shown as sticks and ribbon, respectively. (B) Schematic diagram of the interactions between peptidic and nonpeptidic agonists and GLP-1R. (C) Scatterplot of agonist binding in GLP-1R. All structures were superimposed on the GLP-1–bound GLP-1R coordinates from the OPM database (PDB: 6X18) using the TMD Cα atoms. The x and y axis represent into the depth of the agonist that penetrated the GLP-1R TMD pocket and the buried surface area between the agonist and TMD, respectively. The former is defined as the minimum vertical distance between the heavy atoms of a certain agonist and the carboxyl oxygen atom of E9P in GLP-1 (the deepest atom of GLP-1 that inserted into the TMD), while the latter was calculated using freeSASA. (D) Interface comparison across peptidic and nonpeptidic agonists of GLP-1R. Different regions of the GLP-1R TMD pocket including TM1/7, TM2/3, ECL1 (residues S206 to D222), and the deep pocket (defined as the collection of the residues Y1481.43b-F1952.65b, M2333.36b-V2814.57b, R3105.40b-F3676.56b, and L3887.43b-W4208.61b) were subjected to the interface area calculation.

