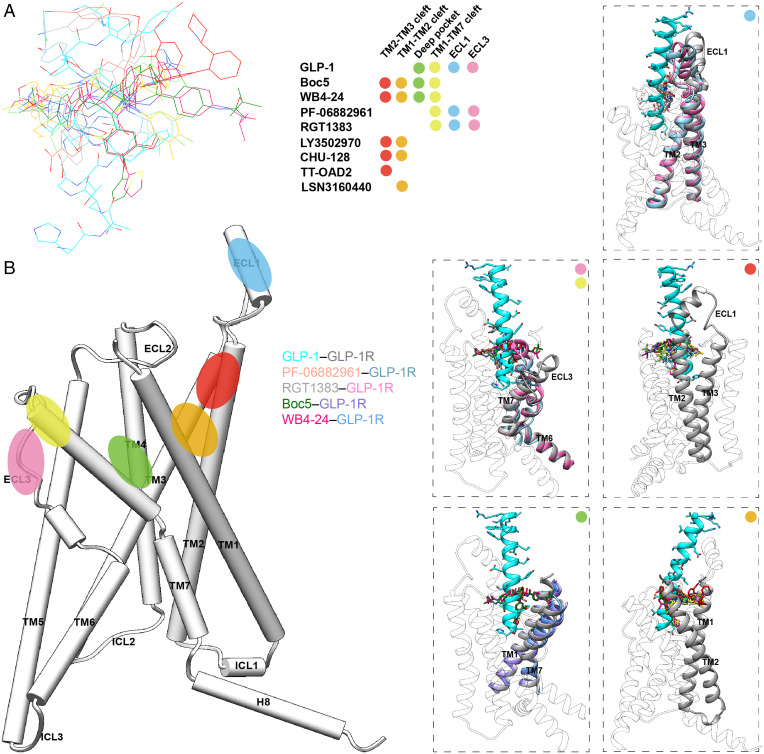
Fig. 5.
Systematic comparison of ligand recognition patterns of different nonpeptidic GLP-1R agonists. (A) Binding poses of the reported nonpeptidic agonists, GLP-1 (residues H7-L20 are shown), and a positive allosteric modulator, LSN3160440. Each ligand is displayed with a different color (GLP-1, cyan; PF-06882961, salmon; RGT1383, gray; Boc5, dark green; WB4-24, magenta; LY3502970, light green; CHU-128, yellow; TT-OAD2, sky blue; and LSN3160440, orange red). The binding sites of these ligands are located mainly in six regions represented by color dots, including the clefts of TM1-TM2 (orange), TM2-TM3 (red), and TM1-TM7 (yellow); ECLs 1 (blue) and 3 (pink); and the deep orthosteric pocket (green). (B) Positions of the binding sites identified among published GLP-1R structures. The dashed boxes show the binding modes of the agonists in specific regions. Colors are consistent with binding sites in panel (A).

