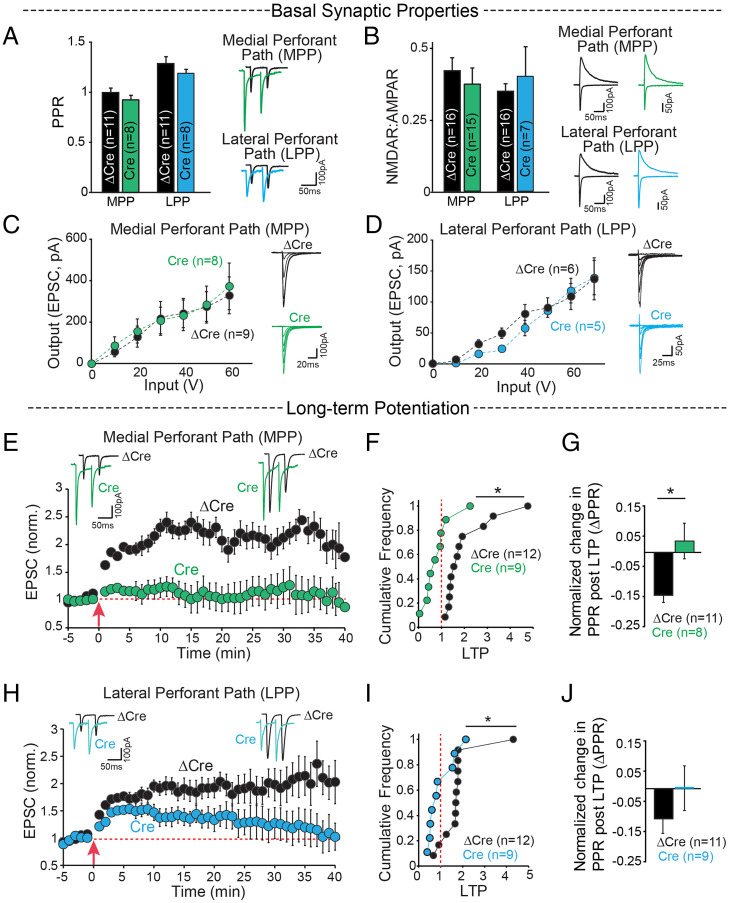
Fig. 2.
Cbln4 deletion in the EC selectively blocks LTP at EC→DG synapses. (A–J) Whole-cell voltage-clamp recordings from dentate gyrus granule cells for stimulation of inputs from the medial entorhinal cortex through the MPP and lateral entorhinal cortex through the LPP from control (ΔCre) and entorhinal cortex Cbln4 KO (Cre) mouse brain slices. (A) Summary graphs (Left) and sample traces (Right) of PPRs show no significant difference between Cre-and ΔCre-injected mice in MPP (ΔCre 0.99 ± 0.05, Cre 0.93 ± 0.05) and LPP (ΔCre 1.28 ± 0.07, Cre 1.19 ± 0.04). (B) NMDA-receptor to AMPA-receptor ratios. MPP: ΔCre 0.42 ± 0.05, Cre 0.37 ± 0.06; LPP: ΔCre 0.35 ± 0.03, Cre 0.40 ± 0.12. (C and D) Summary graphs with sample traces of input–output relationships of AMPAR EPSCs for incremental stimulation intensities show no significant difference between the two conditions. (E–J) Outcome of LTP in EC Cre- and ΔCre-injected Cbln4 cKO mice. (E) Sample EPSC traces before and after LTP induction (Top) and time course (Bottom) for LTP induction in the MPP of control (ΔCre) and entorhinal cortex Cbln4 KO (Cre) mouse brain slices. (F) Cumulative distribution of normalized LTP, ΔCre 2.03 ± 0.31, Cre 0.83 ± 0.21, *P = 0.007. (G) Normalized change in PPR at 35 to 40 min following LTP, ΔCre −0.144 ± 0.02, Cre 0.04 ± 0.06, *P = 0.02). (H–J) Same as E–G, except for LTP induction in the LPP. (H) Sample EPSC traces before and after LTP induction (Top) and time course (Bottom) for LTP induction in the LPP of control (ΔCre) and entorhinal cortex Cbln4 KO (Cre) mouse brain slice. (I) ΔCre 2.11 ± 0.25, Cre 1.11 ± 0.24, *P = 0.04. (J) ΔCre −0.1 ± 0.04, Cre 0.003 ± 0.076.

