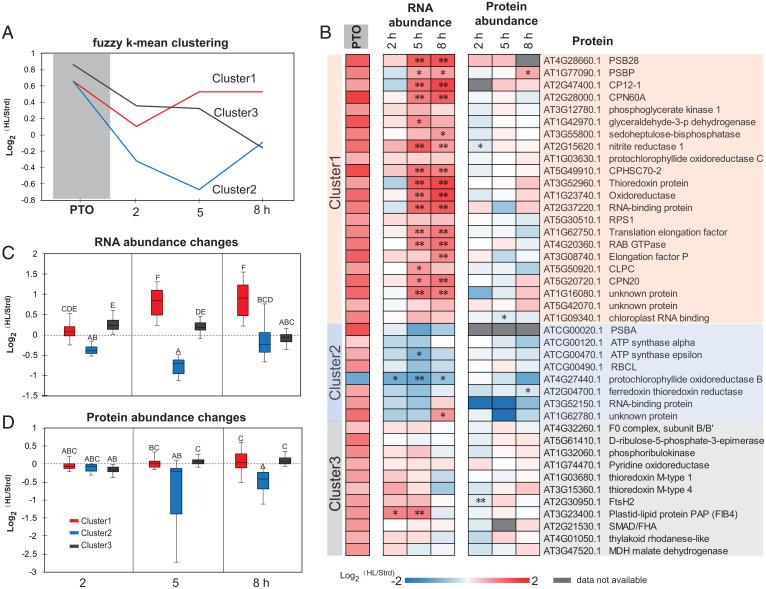
Fig. 5.
Changes in transcript and protein abundance for proteins with significant changes in protein turnover rate during high light treatment. Based on patterns of protein degradation and transcript changes, a fuzzy k-means clustering method was utilized to cluster the 74 proteins with significant changes in protein turnover rate. Representative curves of the three clusters were plotted (A) and values of distance to centroid for specific proteins are provided in SI Appendix, Data S5. Forty-one plastid proteins were extracted from the whole set to show their protein turnover rate alongside fold changes in transcript and protein abundance (B). Boxplots of changes in transcript (C) and protein abundance (D) of each cluster over the time course are shown. PTO, change in protein turnover rate. * shows P for proteins or adjusted P value for transcripts <0.05, ** shows P for proteins or adjusted P value for transcripts <0.01.

