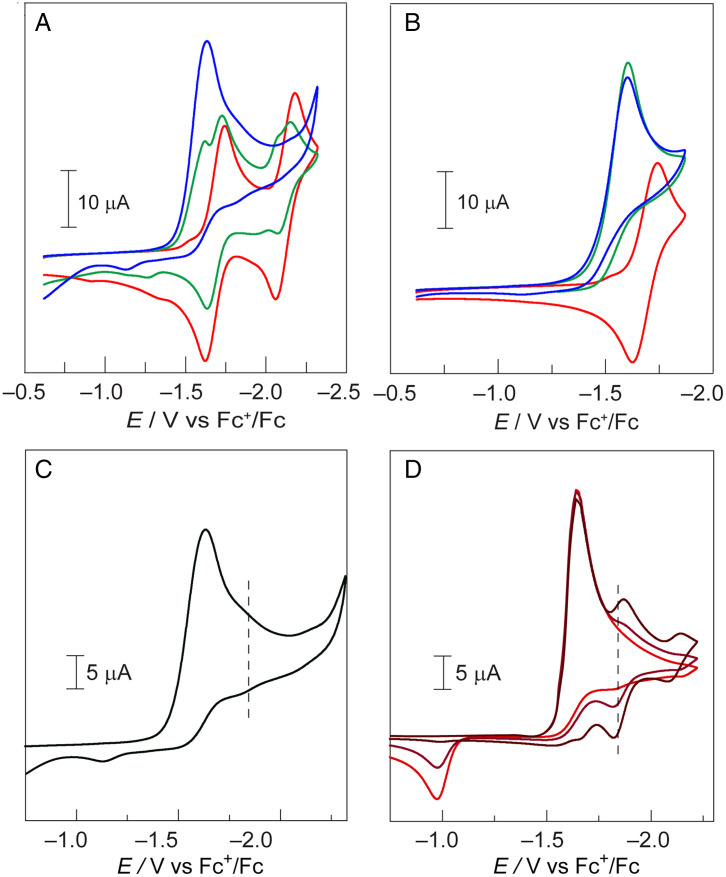
Fig. 5.
CVs of H2CX10-Me (1.6 mM) in the presence of benzoic acid at concentrations of (A) 0 mM (red), 0.5 mM (green), and 2 mM (blue) and for (B) 0 mM (red), 5 mM (green), and 20 mM (blue). (C) CV of H2CX10-Me (1.6 mM) in the presence of 2 mM benzoic acid. (D) Simulated CVs of H2CX10-Me (1.6 mM) in the presence of 2 mM benzoic acid with = 10 M−1 s−1 (red), 100 M−1 s−1 (burgundy), and 1,000 M−1 s−1 (brick red). The dotted vertical lines indicate the location of the Chl(H2) reduction wave. The simulation reproduces experimental CV for = 10 M−1 s−1. All CVs were taken in anhydrous acetonitrile with n-Bu4NPF6 as the supporting electrolyte (0.1 M) using a 3-mm glassy carbon working electrode. v = 0.1 V/s.

