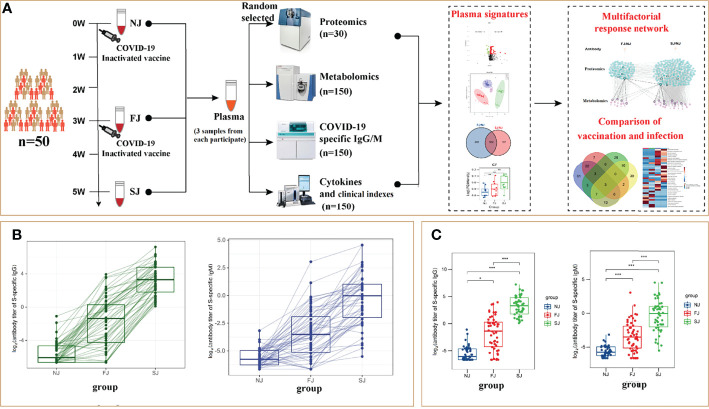
Figure 1.
CoronaVac Study Overview and Antibody Expression. (A) Study overview. Fifty subjects were recruited. Different samples of each subject were taken at NJ (baseline, day 0), FJ (about 21 days after first immunization) and SJ (about 14 days after second immunization). Plasma proteomics, metabolomics, SARS-CoV-2-S-specific antibody titers, cytokines and clinical parameters were analyzed to construct an integrated network. (B) Representative SARS-CoV-2 S-specific IgG and IgM in each subject. (C) Average levels of SARS-CoV-2 S-specific IgG and IgM in each group. The Y-axis labels of Figure (B, C) were Log2 (antibody titer of S-specific IgG or IgM). Statistical significance was determined by two-sided paired Welch’s t test. *p < 0.05; ***p < 0.001.

