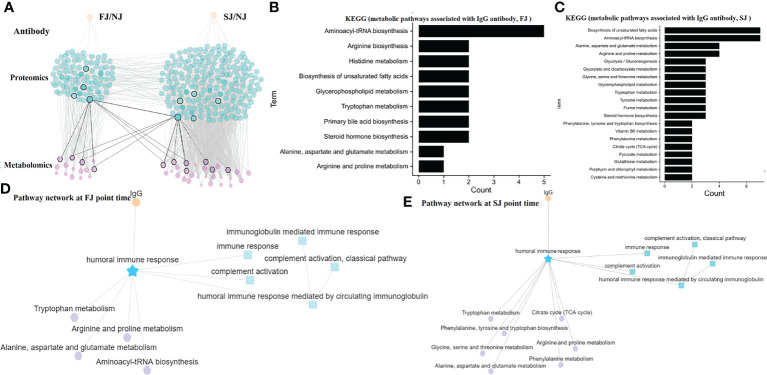
Figure 6.
MRN analysis of Metabolomics, Proteomics, and Antibodies. (A) MRN consists of correlation networks using data from antibody, DEPs, and DEMs. Each node is a child network of one data type. The links between nodes were established by weight. (B) The top 10 pathways for metabolite networks correlated with IgG levels at FJ time point. (C) The top 20 pathways for metabolite networks correlated with IgG levels at SJ time point. (D) Connections between IgG, humoral response associated network and metabolite networks at FJ time point are shown. (E) Connections between IgG, humoral response associated network and metabolite networks at SJ time point are shown.

