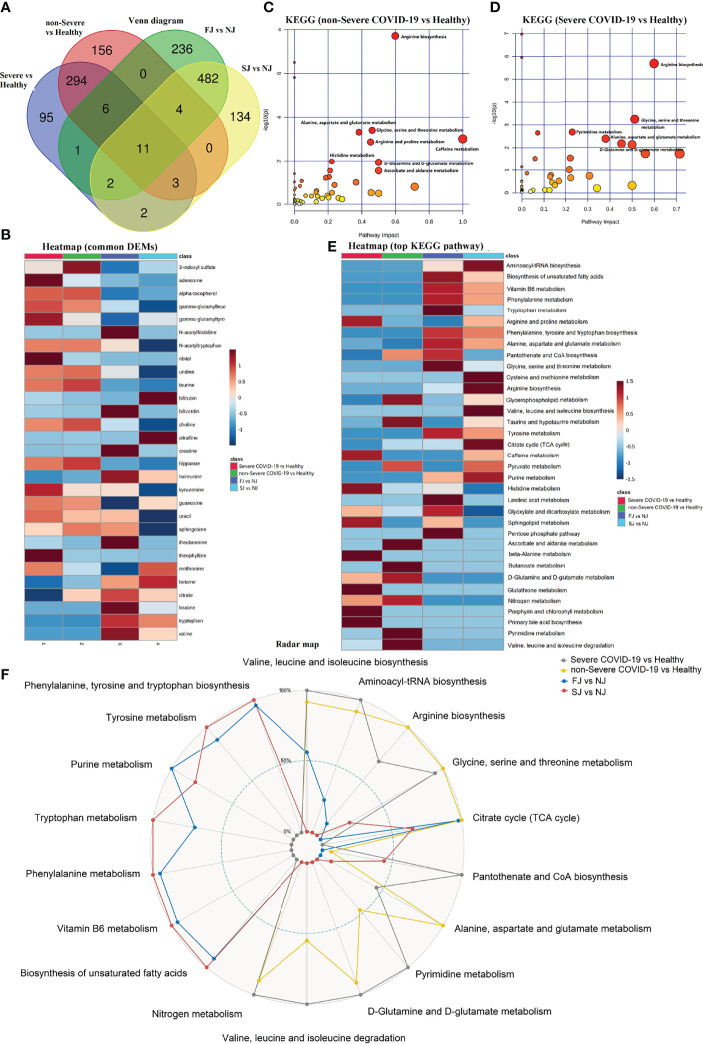
Figure 8.
Comparison of DEMs and their enriched pathways in severe COVID-19 infection, non-Severe COVID-19 infection, FJ and SJ group. (A) Venn diagram showing the number of DEMs from severe COVID-19 vs healthy, non-Severe COVID-19 vs healthy, FJ vs NJ, and SJ vs NJ. (B) Heatmap of the common metabolites shared between CoronaVac immunization and infection. (C) KEGG pathway analysis of DEMs from severe COVID-19 vs healthy. (D) KEGG pathway analysis of DEMs from non-Severe COVID-19 vs healthy. (E) Heatmap of the top KEGG terms enriched from DEMs in severe COVID-19 vs healthy, non-Severe COVID-19 vs healthy, FJ vs NJ and SJ vs NJ. (F) Radar map of the top KEGG terms enriched from DEMs in severe COVID-19 vs healthy, non-Severe COVID-19 vs healthy, FJ vs NJ and SJ vs NJ, respectively. -Log10 p values of KEGG terms were used to make the radar map.

