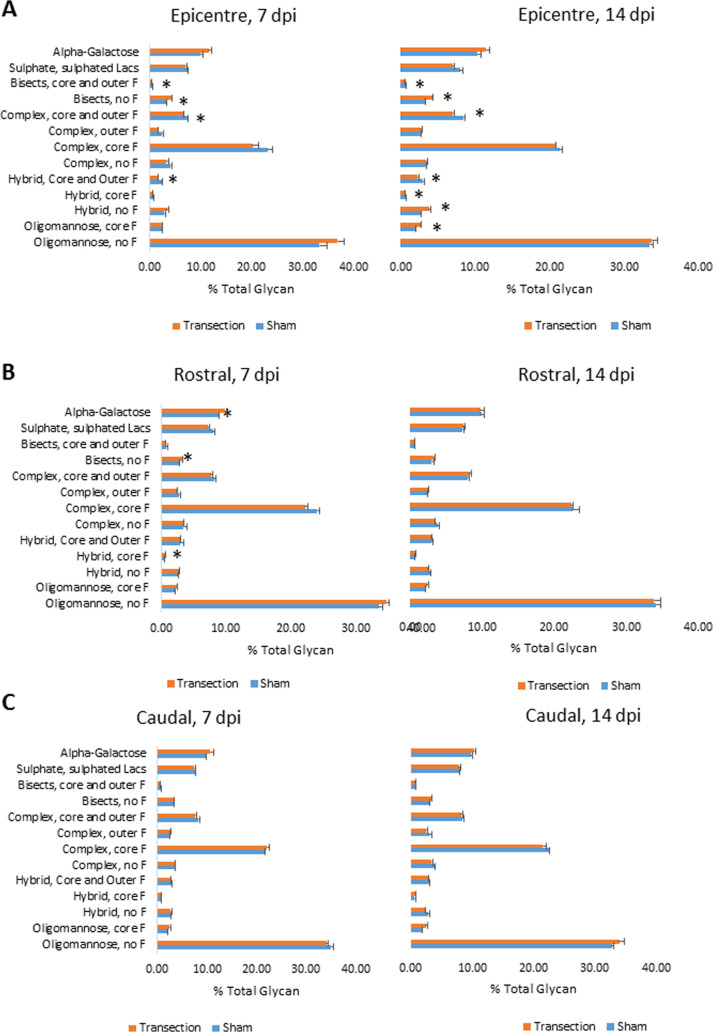
Figure 5.
Differences in N-glycan features between sham and transection-only groups, at 7 and 14 dpi in the rat spinal cord. (A) Lesion epicenter, (B) rostral to injury, and (C) caudal to injury. Asterisks indicate a statistically significant difference between sham and transected groups, using the t-test, n = 3, p < 0.05.

