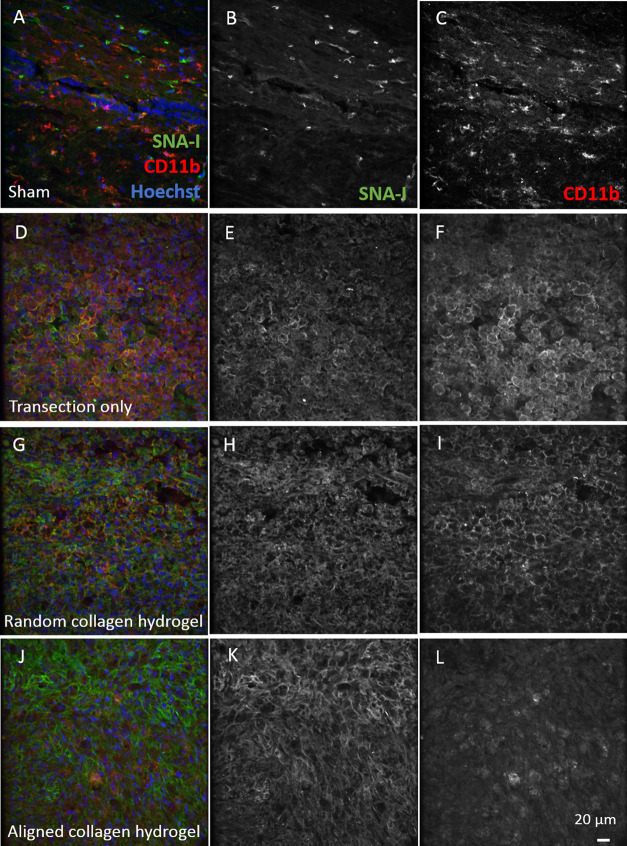
Figure 7.
Distribution of sialic acid labeled with SNA-I lectin and its relationship to CD11b-positive microglia and macrophages in the rat spinal cord. (A–C) Sham (D–F) transection-only, (G–I) random collagen hydrogel-treated, and (J–L) aligned collagen hydrogel-treated. SNA-I single-channel images are shown for each group in (B, E, H, K); CD11b single-channel images are in (C, F, I, L). Images from injured animals (D–L) were captured at the borders of the injury. All images are from the spinal cord at 7 dpi. Scale bar is 20 μm.

