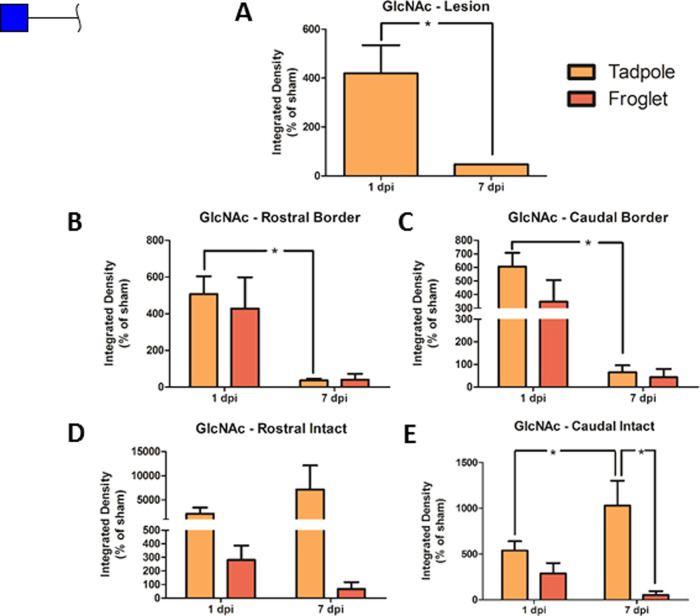
Figure 8.
Changes in GlcNAc following SCI in pre-and postmetamorphic X. laevis. Graphs show DSA lectin staining in spinal cord tissue in tadpole lesion epicenter (A) and in tadpole and froglet lesion borders rostral (B) and caudal (C) and in intact tissue rostral (D) and caudal (E) at 1 and 7 dpi. Data were normalized to sham before analysis with two-way ANOVA and Bonferroni’s post hoc test, and are presented as mean ± SEM. A value of p < 0.05 was considered significant. Groups that differ significantly are indicated with an asterisk.

