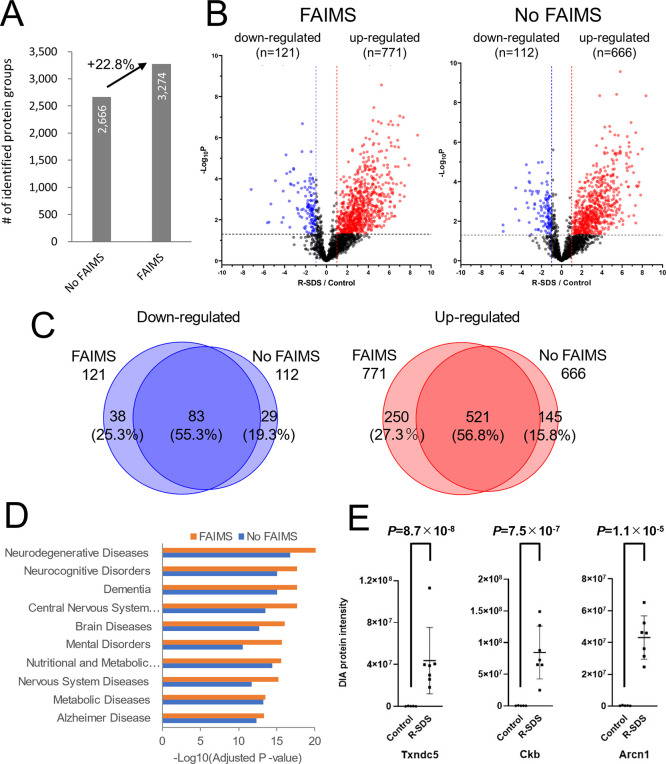
Figure 5.
Changes in fecal host proteins in a mouse model of R-SDS determined by the ultradeep proteome analysis. (A) Number of protein groups identified using DIA-MS with and without FAIMS. (B) Volcano plot of the intensities of the host protein obtained from the feces of the R-SDS model and control mice. The red dots were proteins that were upregulated in the feces of the R-SDS model mice, and the blue dots were proteins that were downregulated in the feces of the R-SDS model mice. (C) Overlap between altered proteins in R-SDS feces detected by DIA-MS with FAIMS and those detected by DIA-MS without FAIMS. (D) Disease ontology enrichment analysis of host proteins upregulated in the feces of the R-SDS model mice. (E) Protein intensities of three representative proteins upregulated in the feces of the R-SDS model mice.

