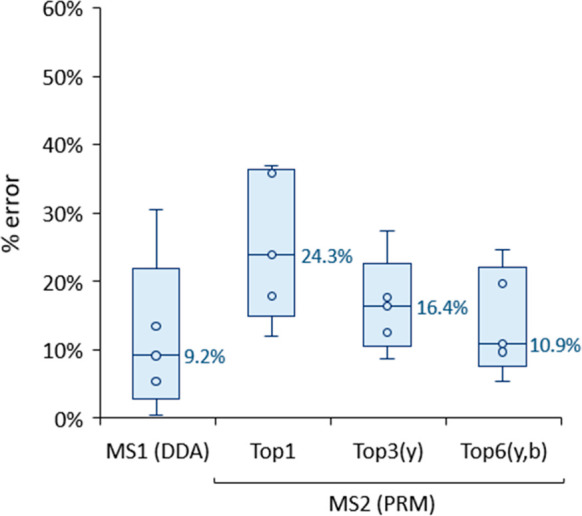
Figure 6.

Relative error in the quantification of CPs using Rs-peptides and either MS1 or MS2 (summed) intensities of different fragment ions. Top1 (the top fragment ion); Top3(y) (sum of the top three y-ions, matching between Rn and Rs); Top6(y,b) (sum of the top six fragments within y- and b-ions). Each box contains information from 5 Rs-peptides (detailed information is provided in Table S2), while the median values are given next to the boxes. Each box plot displays the median (line), the 25th and 75th percentiles (box), and the 5th and 95th percentiles (whiskers).
