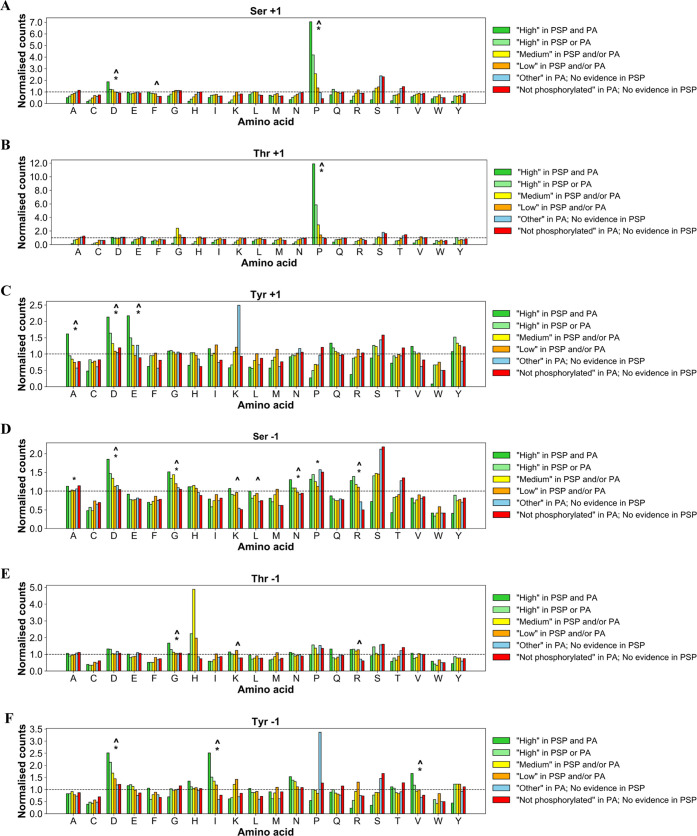
Figure 4.
Counts of proximal amino acids positioned at (A) +1 around Ser; (B) +1 around Thr; (C) +1 around Tyr; (D) −1 around Ser; (E) −1 around Thr; and (F) −1 around Tyr sites of various phosphorylation likelihood based on evidence in PSP and PA, normalized to the observed distribution of those amino acids in human proteome (represented by dotted baseline fixed at 1). Significant (Bonferroni corrected p value <0.001) enrichment of proximal amino acids in the “High in PSP and PA” set is highlighted by the caret symbol (∧) compared with the “Not phosphorylated” set, and an asterisk (*) compared to the expected amino acid distribution.

