
Figure 6.
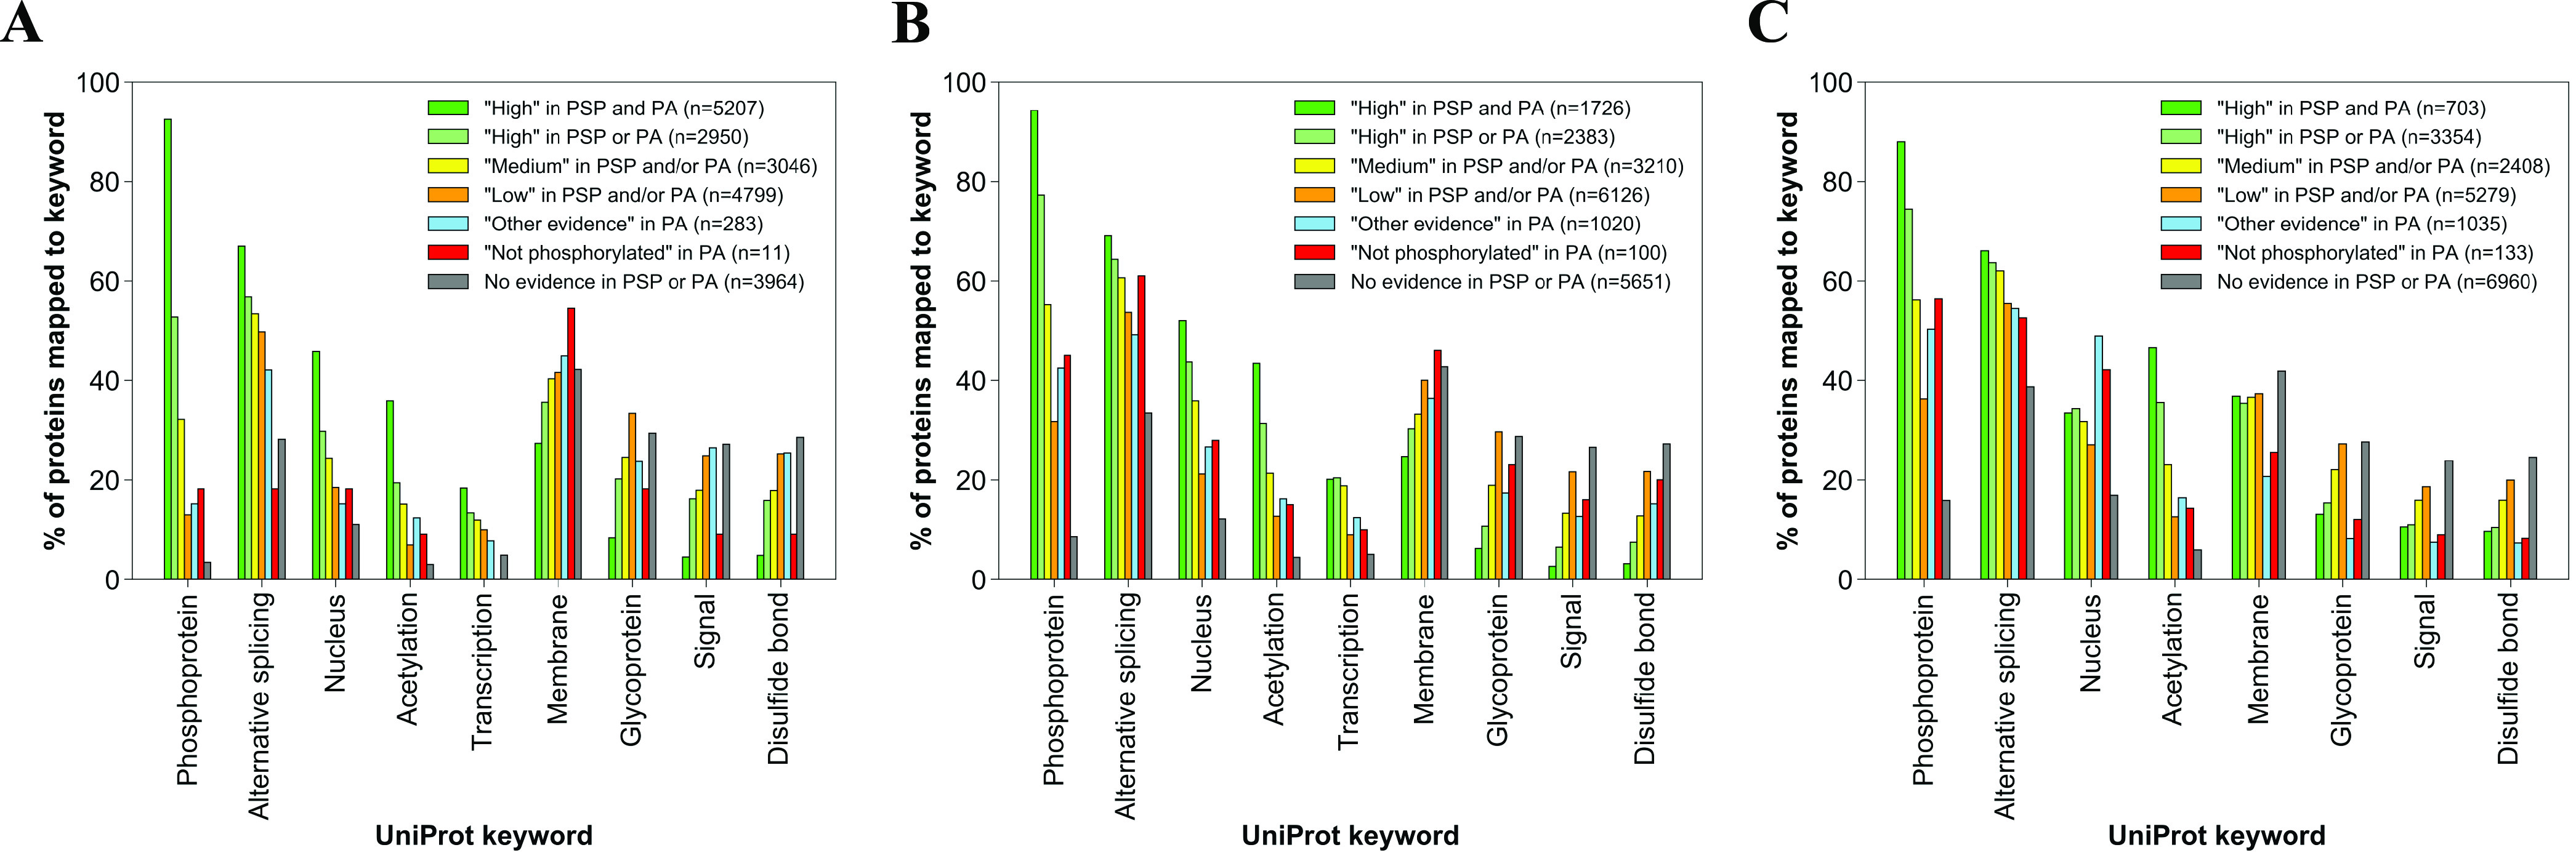
Percentage of proteins within sets containing (A) Ser, (B) Thr, and (C) Tyr sites of various phosphorylation likelihood as their highest-ranked site, annotated with specific UniProt keywords. The number of proteins in each set is presented by n.