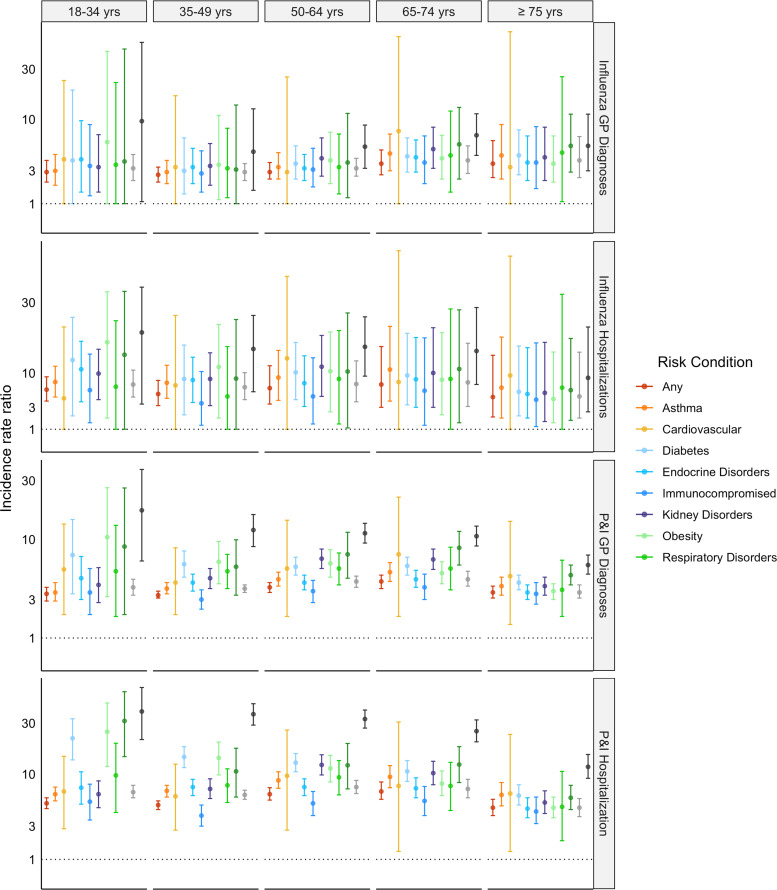
Fig. 3.
Influenza and ‘pneumonia & influenza’ (P&I) incidence rate ratios for general practitioner (GP) diagnoses and hospitalisations by specific risk condition vs. no risk condition (reference group), stratified by age group. yrs, years; any, any risk condition. Blood disorders, liver disorders and neurological disorders were excluded because they occur in ~<1% of the study population. Y-axis scale was reduced to improve readability. The full figure is available in the Supplementary Figure S2.

