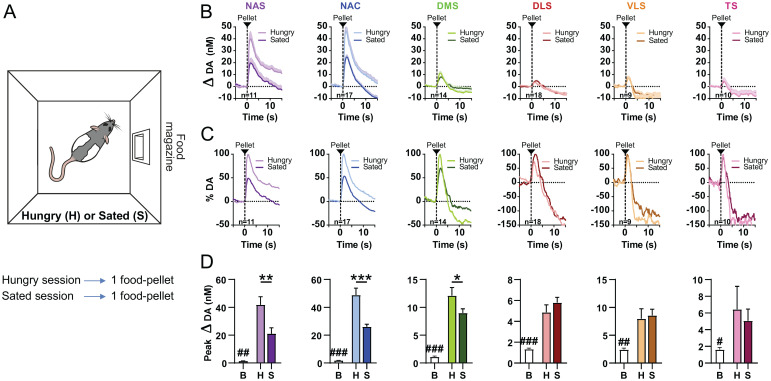
Fig. 3.
Satiety state–dependent regional differences in reward-induced dopamine (DA) release. (A) On two days, rats received unpredicted food pellets separated by a variable ITI. On 1 d, rats were hungry (H; food restricted to 85% of their free-feeding weight). On the other day, rats were sated (S; prefed via 1-h ad libitum access to food pellets immediately prior to testing). (B) Changes in dopamine concentration in NAS, NAC, DMS, DLS, VLS, and TS in response to an unpredicted food pellet in hungry and sated rats (traces are aligned to food-pellet delivery). (C) Data from B are displayed as a percentage of maximum (average) dopamine release. (D) Dopamine release in response to reward was increased in all striatal regions when compared with baseline (B). Dopamine release in NAS, NAC, and DMS was lower in sated than in hungry rats, but not in DLS, VLS, and TS. Bar graphs depict (positive) peak concentrations of dopamine averaged across rats for baseline (−2 to 0 s) and reward (0 to 5 s) epochs. (B and D) Data are reported as mean + SEM. Comparison to baseline (B): #P < 0.05, ##P < 0.01, ###P < 0.001; Comparison H vs S: *P < 0.05, **P < 0.01, ***P < 0.001.

