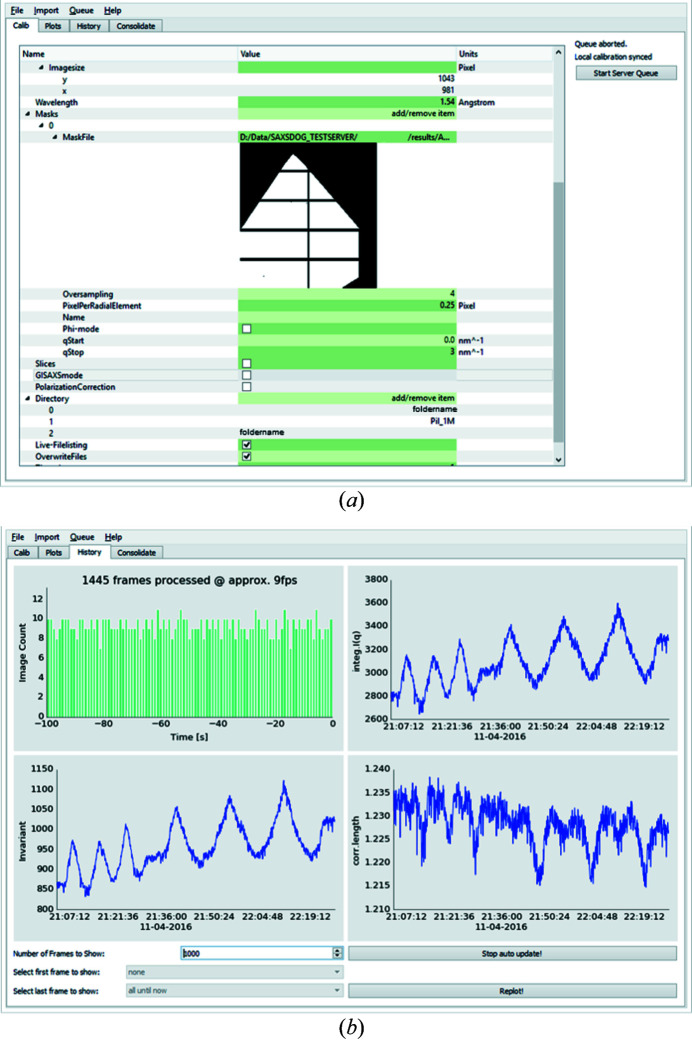
Figure 4.
Screenshot of the SAXSLEASH GUI. (a) The calibration tab allows the user to display and alter all required and optional integration parameters. (b) The history tab shows the current progress of the integration on the SAXSDOGSERVER [progress histogram (top left)] and visualizes the calculated image classifiers [integral intensity (top right), invariant (bottom left) and correlation length (bottom right)].

