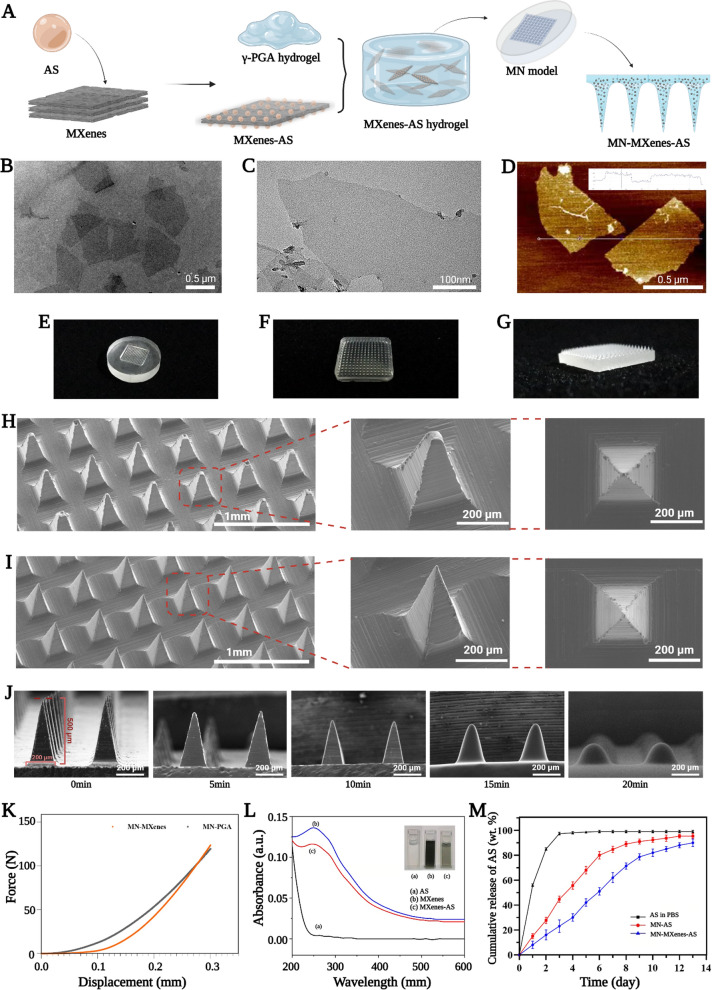
Fig. 1.
Synthesis and characterization of MN-MXenes-AS. A Schematic illustration of the synthesis of an MN-MXenes-AS. B, C The TEM images of MXenes. D The AFM image of MXenes. E Photographic image of PDMS microneedle master mold. F, G Profile and isometric photographic images of an MN-MXenes-AS. H SEM images of an MN-PGA patch with different angles. I SEM images of an MN-MXenes-AS patch with different angles. J SEM images of MN after moisture absorption at different time points (75% humidity box, room temperature). K The comparison between the mechanical strength of MN-PGA and MN-MXenes-AS. L Absorption spectrum of AS, MXenes and MXenes-AS. M Percentages of the released AS from an MN-AS, MN-MXenes-AS in the presence of PBS or from AS in PBS

