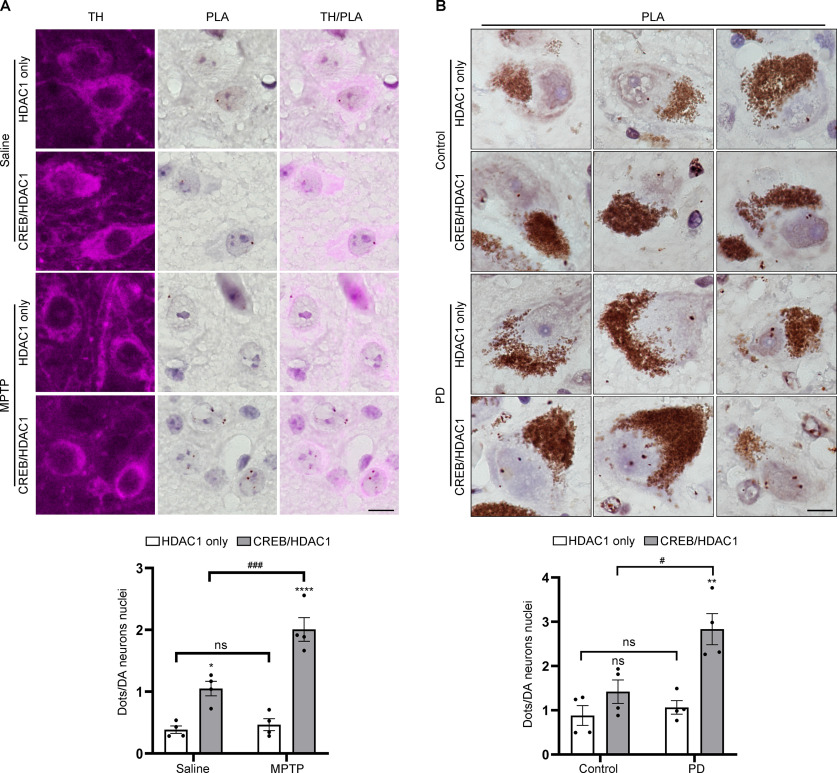
Figure 3.
Increased interaction between CREB and HDAC1 in SN dopaminergic neurons in PD. A, PLA was performed with HDAC1 and CREB in mouse SN dopaminergic neurons (top); n = 4 per group. Scale bars, 10 μm. Quantification of dopaminergic neuron nuclear PLA signal (bottom). B, PLA was performed with HDAC1 and CREB in the human SN dopaminergic neurons (top); n = 4 per group. Scale bars, 10 μm. Quantification of dopaminergic neuron nuclear PLA signal (bottom). Two-way ANOVA (Tukey's): *p < 0.05, **p < 0.01, ****p < 0.0001 versus Saline/Control group; #p < 0.05, ###p < 0.001, ns, not significant as indicated.

