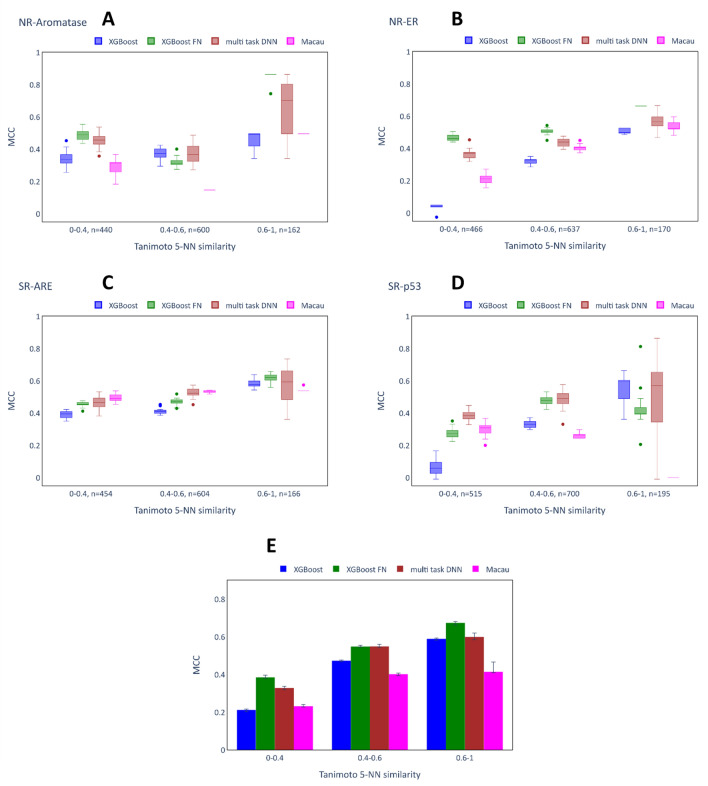
Fig. 9.
Performance of imputation models depending on test compound chemical similarity: Tox21. A–D show the MCC scores obtained in 20 independent runs (same hyperparameters, different random seeds) of the models on the different bins of the test set for NR-Aromatase, NR-ER, SR-ARE, SR-p53 (representative assays). The number (n = x) written next to each bin indicates the number of compounds placed in the bin. E shows the median MCC scores and interquartile ranges across the different runs after computing the mean across all the assays for a single run.

