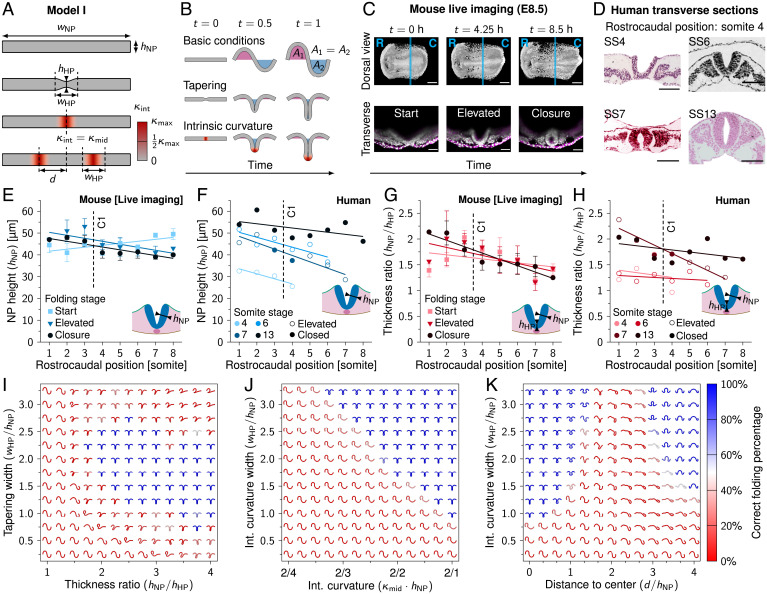
Fig. 2.
Intrinsic NP curvature and midline tapering can promote tube folding. (A) Schematic representation of model I. , NP width; , NP apicobasal height; , MHP (midline) height; , hinge point domain width; d, domain distance to center; , intrinsic tissue curvature; , intrinsic tissue curvature at the hinge point midline; , theoretical maximum tissue curvature. (B) Model I simulations rendered between t = 0 ( µm) and t = 1 ( µm). The area underneath the tissue horizontal midline is fixed at 0. (C) Mouse live-imaging of early NT closure at E8.5. R, rostral; C, caudal; magenta, cell membrane; white, nucleus. Cyan lines in dorsal view images indicate rostrocaudal position (somite 4.5) of transverse view. (Scale bars: 200 µm [dorsal view] and 100 µm [transverse view].) (D) Human transverse sections of early NT closure at SS4 to SS13, rostrocaudal position somite 4. Images were derived with permission from refs. 35 and 36 under a Creative Commons Attribution license. (Scale bars: 100 µm.) (E) Measured NP apicobasal height () during NT folding progression along the rostrocaudal axis in developing mouse embryos. (F) Measured NP apicobasal height () along the rostrocaudal axis in human embryos (SS4, SS6, SS7, and SS13). (G) Measured NP midline thickness ratio () during NT folding progression along the rostrocaudal axis in developing mouse embryos. (H) Measured NP midline thickness ratio () along the rostrocaudal axis in human embryos (SS4, SS6, SS7, and SS13). Lines in E–H represent linear least-squares fit; C1 indicates closure 1 rostrocaudal position. In E and G, error bars indicate SEM, (SI Appendix, Table S1). In F and H, open circles indicate that NP is in the process of folding; closed circles indicate that NP is closed. (I–K) NP folding simulations (t = 1) with midline tapering thickness ratio versus tapering domain width (I), intrinsic midline curvature strength versus intrinsic curvature domain width (J), and intrinsic dorsolateral curvature () distance to center versus intrinsic curvature domain width (K). In I, simulation renderings were flipped along the y axis to point downward. Color scale represents the percentage of intermediate simulation steps in which the neural ectoderm is sufficiently symmetrical along the x axis and the neuroepithelium midline is buckled; i.e., the sum of the x coordinates of the elements on the left and right half of the neural ectoderm differ by less than 10%, and the middle element has .

