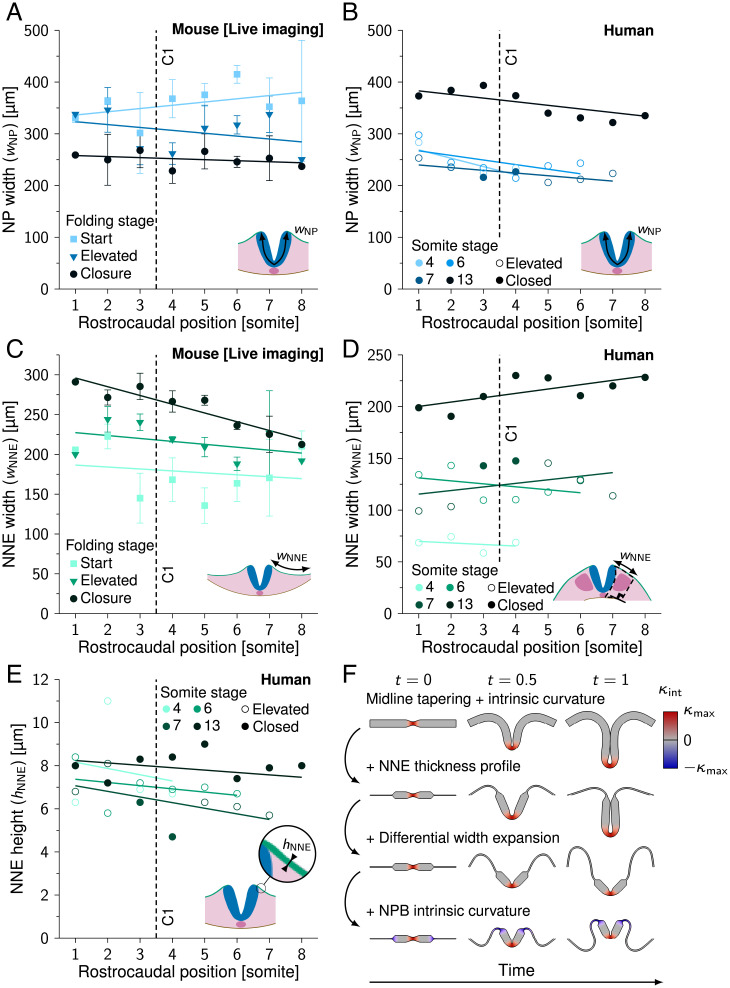
Fig. 3.
NNE width expansion in NT folding. (A) Measured NP width () during NT folding progression along the rostrocaudal axis in developing mouse embryos. (SI Appendix, Table S1). (B) Measured NP width () along the rostrocaudal axis in human embryos (SS4, SS6, SS7, and SS13). (C) Measured NNE width () during NT folding progression along the rostrocaudal axis in developing mouse embryos. (SI Appendix, Table S1). (D) Measured NNE width () along the rostrocaudal axis in human embryos (SS4, SS6, SS7, and SS13). (E) Measured NNE height () along the rostrocaudal axis in human embryos (SS4, SS6, SS7, and SS13). Lines in A–E represent linear least-squares fits, C1 in A–E indicates closure 1 rostrocaudal position, and error bars in A and C indicate SEM. In B, D, and E, open circles indicate that NP is in the process of folding; closed circles indicate that NP is closed. (F) Model I simulations rendered between t = 0 and t = 1. First row, midline thinning + midline intrinsic curvature; second row, previous simulation + NNE thickness profile; third row, previous simulation + differential width expansion; fourth row, previous simulation + NP border intrinsic curvature. Red, inward (midline) intrinsic curvature; blue, outward (NP border) intrinsic curvature.

