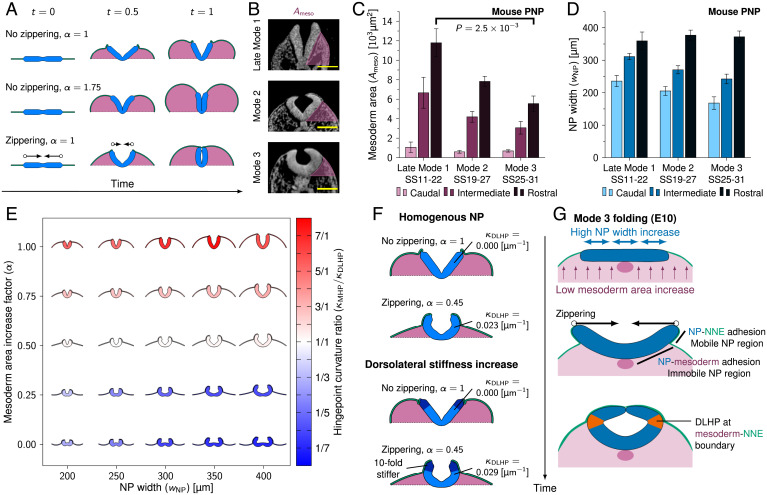
Fig. 5.
Zippering drives DLHP formation at sites with low mesoderm area increase. (A) Model II simulations with flat initial configurations rendered between t = 0 and t = 1. Arrows indicate zippering direction, and pink area indicates mesoderm area increase. (B) Transverse sections through the PNP at late mode 1, mode 2, and mode 3. Pink area indicates . Images were derived with permission from refs. 7 and 8 under a Creative Commons Attribution license. (Scale bars: 100 µm.) (C and D) Measured mesoderm area (; C) and NP width (; D) during NT folding progression at modes 1 to 3 in the developing mouse PNP. For late mode 1, N = 5; for mode 2, N = 12; and for mode 3, N = 7. Error bars indicate SEM. In C, Mann–Whitney u test is used, . (E) NP folding simulations (model II + zippering) rendered at t = 0.7 with NP width () versus mesoderm area increase factor (α). Color indicates the ratio of MHP curvature versus DLHP curvature. Red indicates that MHP dominates (mode 1), white indicates that both MHP and DLHPs (mode 2), and blue indicates that DLHPs dominate (mode 3). DLHP curvature was the highest curvature measured between the MHP and NP border regions at one of the NP lateral sides. (F) Model II simulations rendered at t = 0.7 with and without 10-fold dorsolateral NP stiffness increase (dark blue regions). (G) Proposed biomechanical mechanism of DLHP formation. The E10 PNP shows high NP width increase and low mesoderm area increase (Top), which causes the NP lateral sides to elevate above the mesoderm and form basal contact with the NNE (Middle). The lateral NP regions are therefore mobile and get pulled inward through zippering, resulting in DLHPs at the mesoderm–NNE boundary (Bottom).

