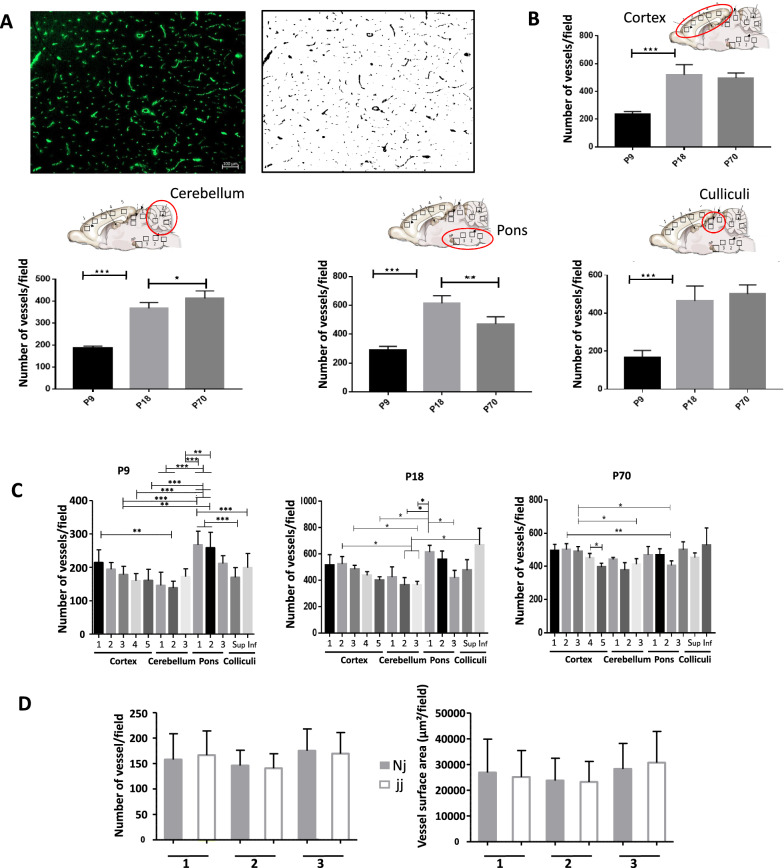
Fig. 1.
Cerebral vascularization in normobilirubinemic and hyperbilirubinemic animals during post-natal development. A Typical immunohistological staining of the endothelial-specific RECA-1 protein on brain section, and corresponding transformed black and white image generated using ImageJ software and allowing to quantify the number of microvessel segments and the surface area per field of observation (1.42 mm2 field); B Number of vessel segments per field in the cortex, cerebellum, pons and colliculi at three postnatal developmental stages in normobilirubinemic Nj animals. The data represent an average of measurements from 3 to 5 different locations (squares on the drawings) within each structure; C Comparative analysis of the number of vessel segments in several subregions of brain structures at the three different ages studied in normobilirubinemic Nj animals; D Comparative analysis of the number of vessel segments (left), and of vessel surface area (right), per field in three regions of the cerebellum (insert in B) between non-jaundiced and jaundiced 9-day-old animals. All data are expressed as means ± SD n = 4 animals (2 males, 2 females) for 9-day-old (P9) and 70-day-old rats (P70), and n = 6 animals (3 males, 3 females) for 18-day-old rats (P18), for each genotype. All fields had the same surface area of 1.42 mm2. *, **, ***: statistically different values, p < 0.05, p < 0.01, p < 0.001, respectively, Anova followed by Tukey’s multiple comparisons test. For 9-day-old animals in C, only ** and *** significances are shown

