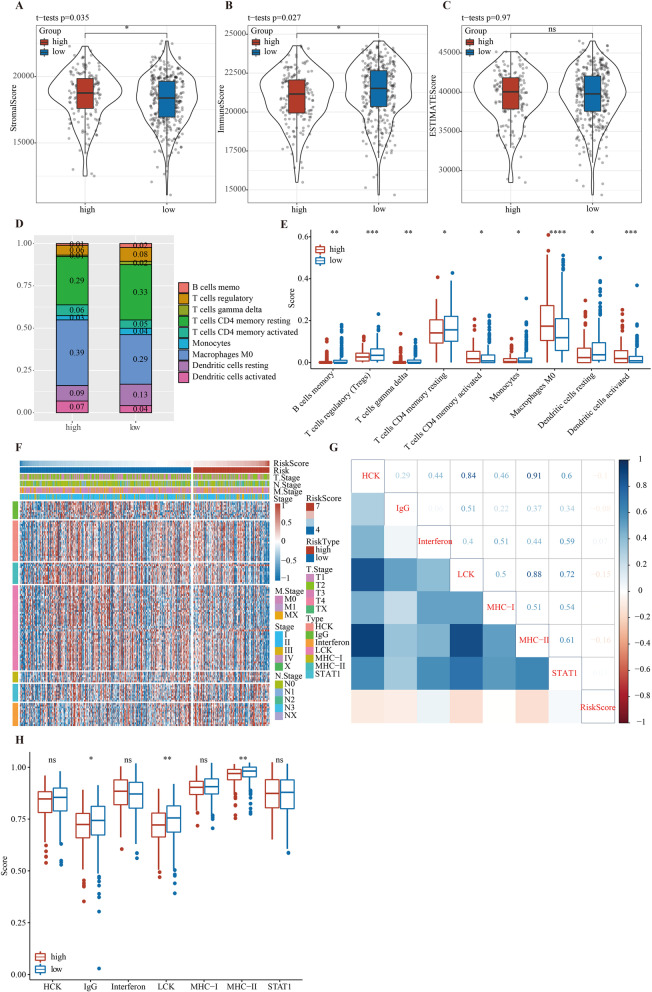
Fig. 6.
Immune cell infiltration and inflammation between high- and low-risk scores. A–C Stromal score, immune score, and ESTIMATE score between the high-risk score group and low-risk score group. D Boxplot showed the infiltration ratio of 9 immune cells in high- and low-risk groups. E Boxplot of infiltration scores of 9 kinds of immune cells in high- and low-risk groups. F Heat map displayed the relationship between risk score and 7 metagenes. G Correlation matrix of risk score and the seven metagenes. H Boxplot of the correlation between risk score and 7 metagenes

