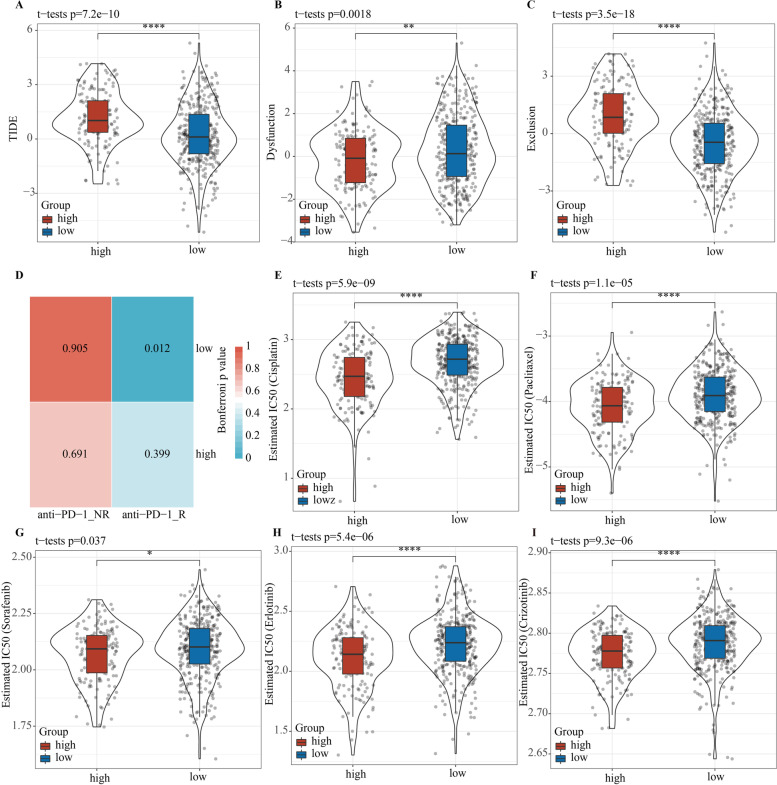
Fig. 7.
Predictive value of risk score for immunotherapy, chemotherapy, and targeted therapies. A Violin plots visualized the TIDE score between high- and low-risk groups. B Differences in T cell exclusion among patients with different risks. C Violin plots of the T cell dysfunction value for high- and low-risk groups. D Subclass mapping analyzed the response to anti-PD-1 treatment between high- and low-risk groups. Violin plots exhibited the diversity in estimated IC50 values of cisplatin (E), paclitaxel (F), erlotinib (G), sorafenib (H), and crizotinib (I) between high- and low-risk groups

